Database last updated: September 2026
What is a Clearinghouse?
A "clearinghouse" can be defined as an entity or platform that collects, organizes, and disseminates information or resources on a specific topic. The purpose of such a clearinghouse is to curate and manage data in order to facilitate knowledge sharing, support evidence-based decision-making, and promote best practices within a particular domain or across multiple sectors.
What does the PFAS-ARC Web Tool do?
- Serves as a clearinghouse of PFAS remediation technologies, including in situ and ex situ approaches for impacted solids (e.g., soils and spent treatment media) and liquids (e.g., groundwater, AFFF, landfill leachate, treatment concentrate).
- Provides Technology Snapshots for each remediation technology, which include descriptions, strengths, weaknesses, and links to additional resources (e.g., EnviroWiki).
- Includes a Performance Evaluation tool to visualize quantitative performance (concentrations and percent removal of various PFAS) in solids and liquids obtained from available data.
New here? See the Quick Start Guide for a walkthrough of the Performance Evaluation pages.
Which Media and Technologies are Included?
Studies in PFAS-ARC are categorized by the environmental media evaluated and are organized into liquid and solid matrices.
Liquid media include:
- Groundwater (field‑collected or spiked/synthetic)
- Aqueous film‑forming foam (AFFF) or diluted AFFF
- Treatment concentrate (e.g., from concentration technologies)
- Landfill leachate
- Ion exchange (IX) still bottoms or regeneration brine
Solid media include:
- Soil (field‑collected or spiked/synthetic)
- Spent treatment media (e.g., GAC and IX resins)
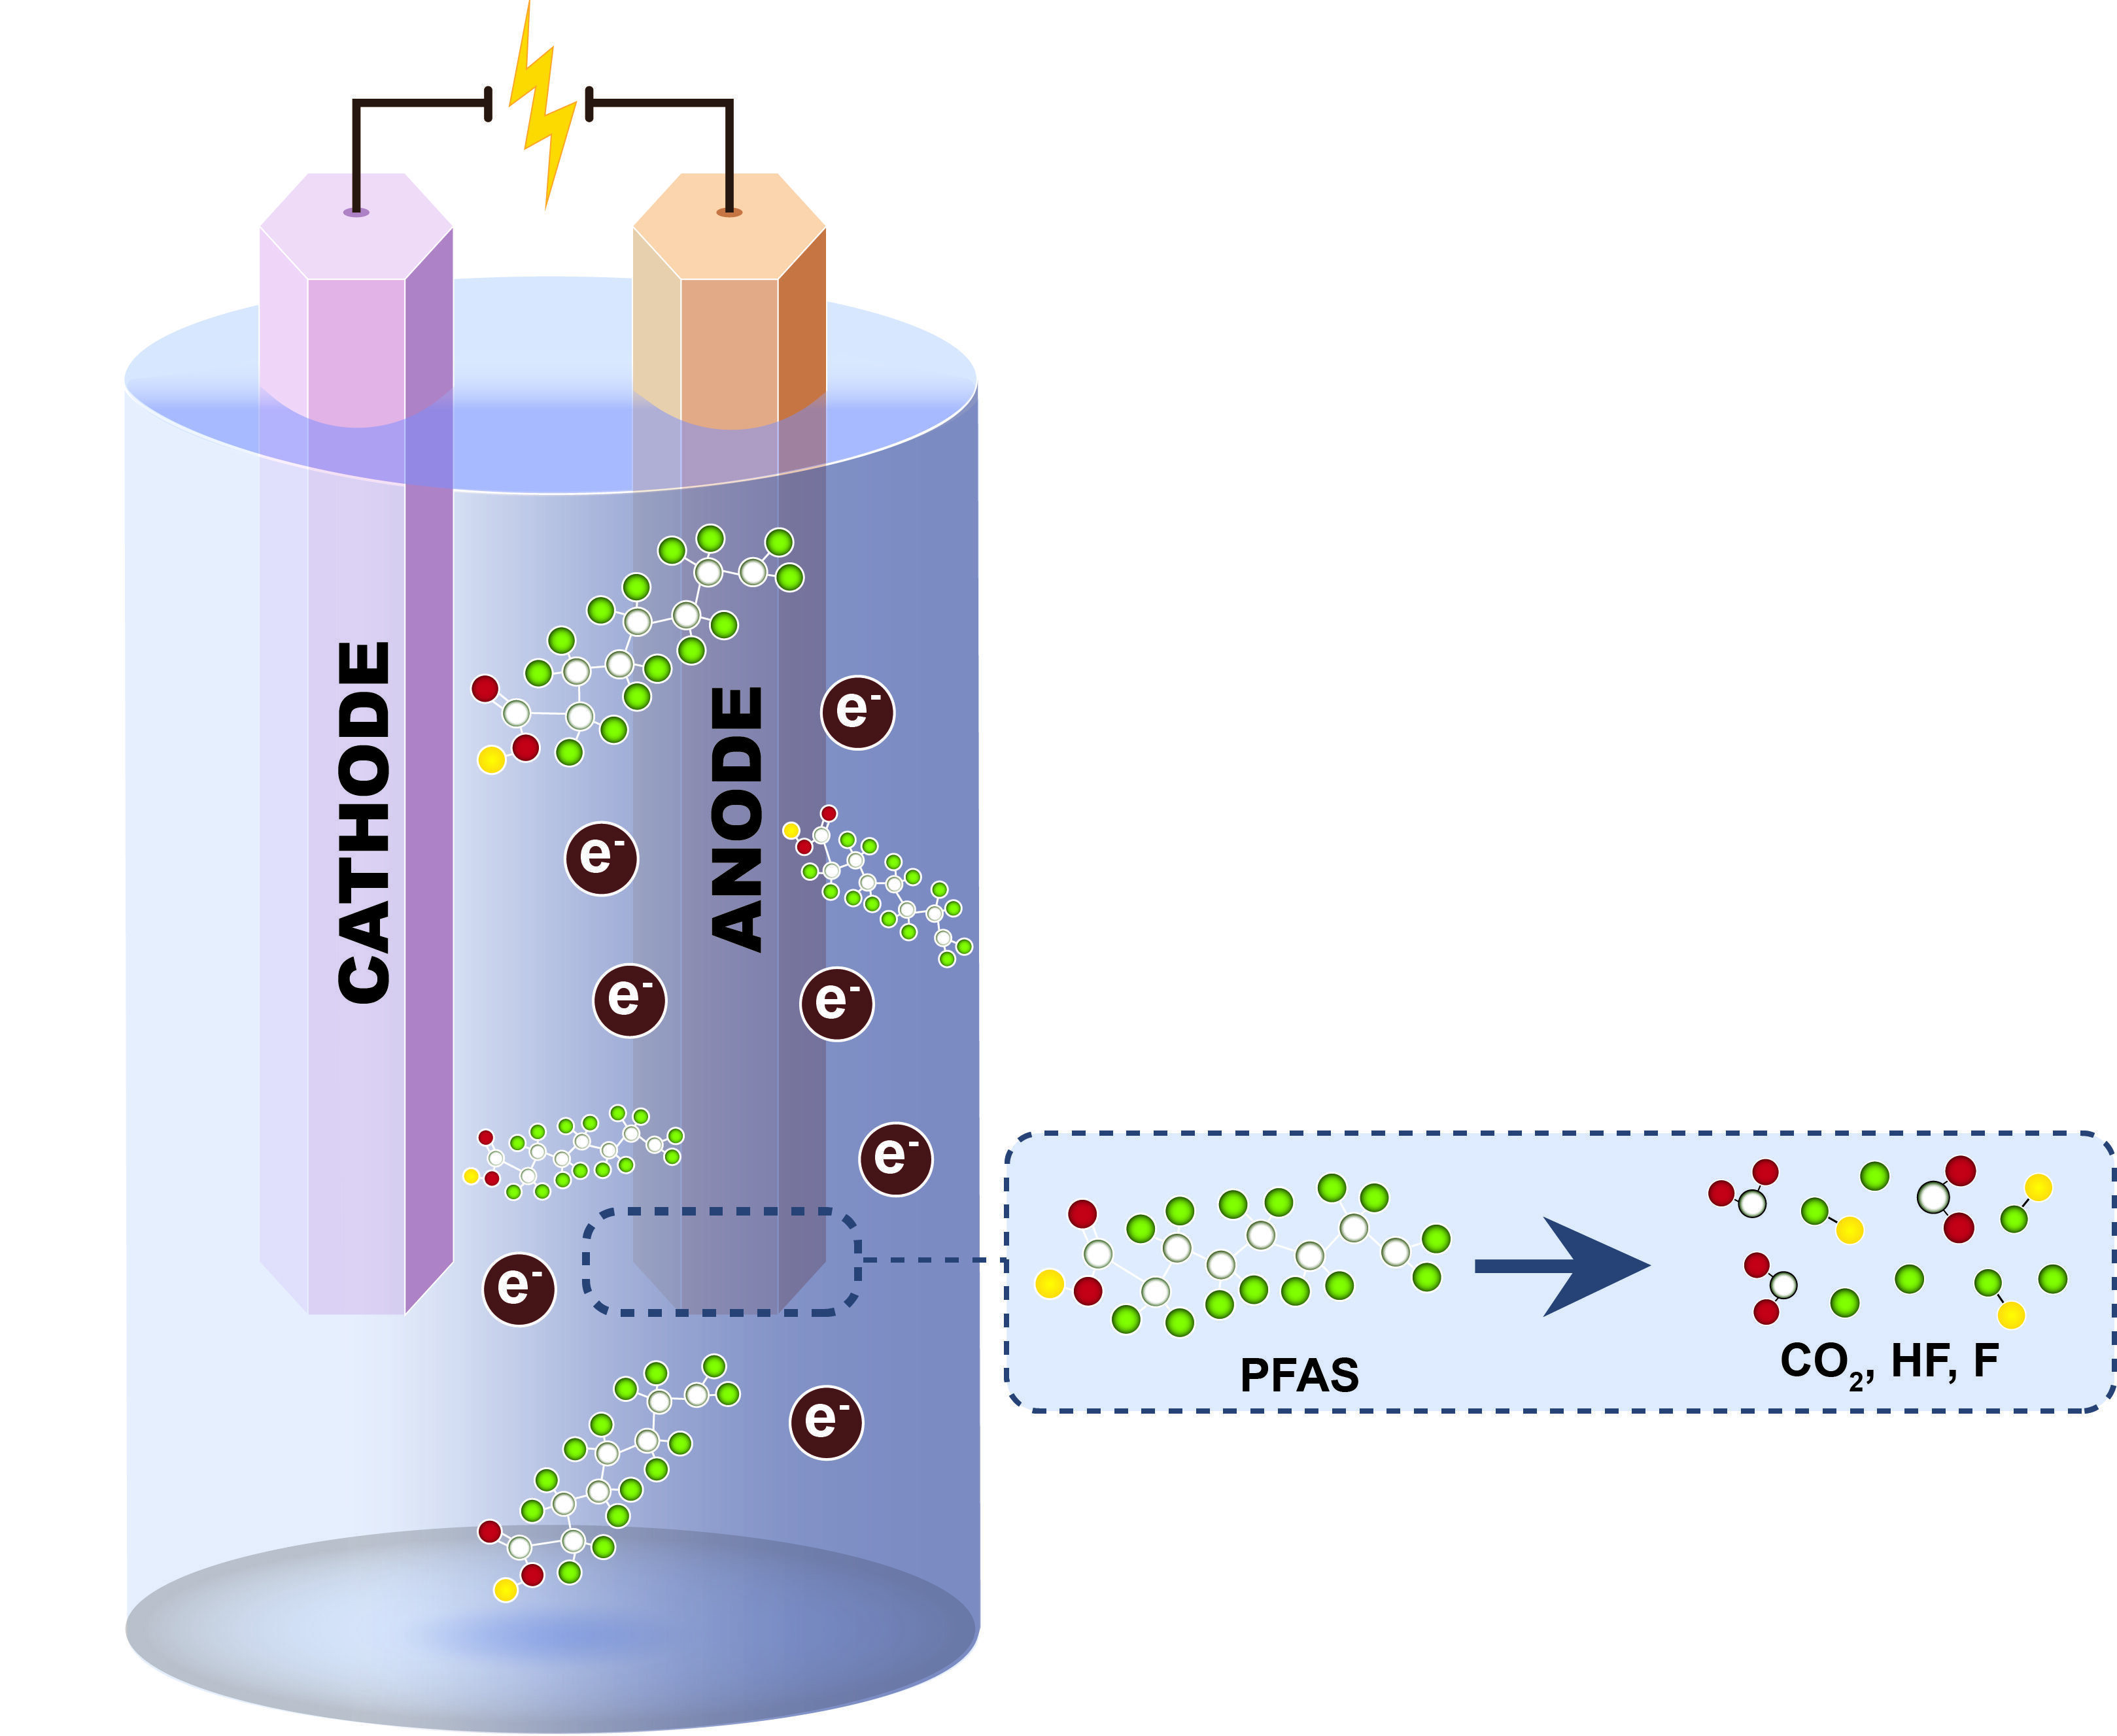
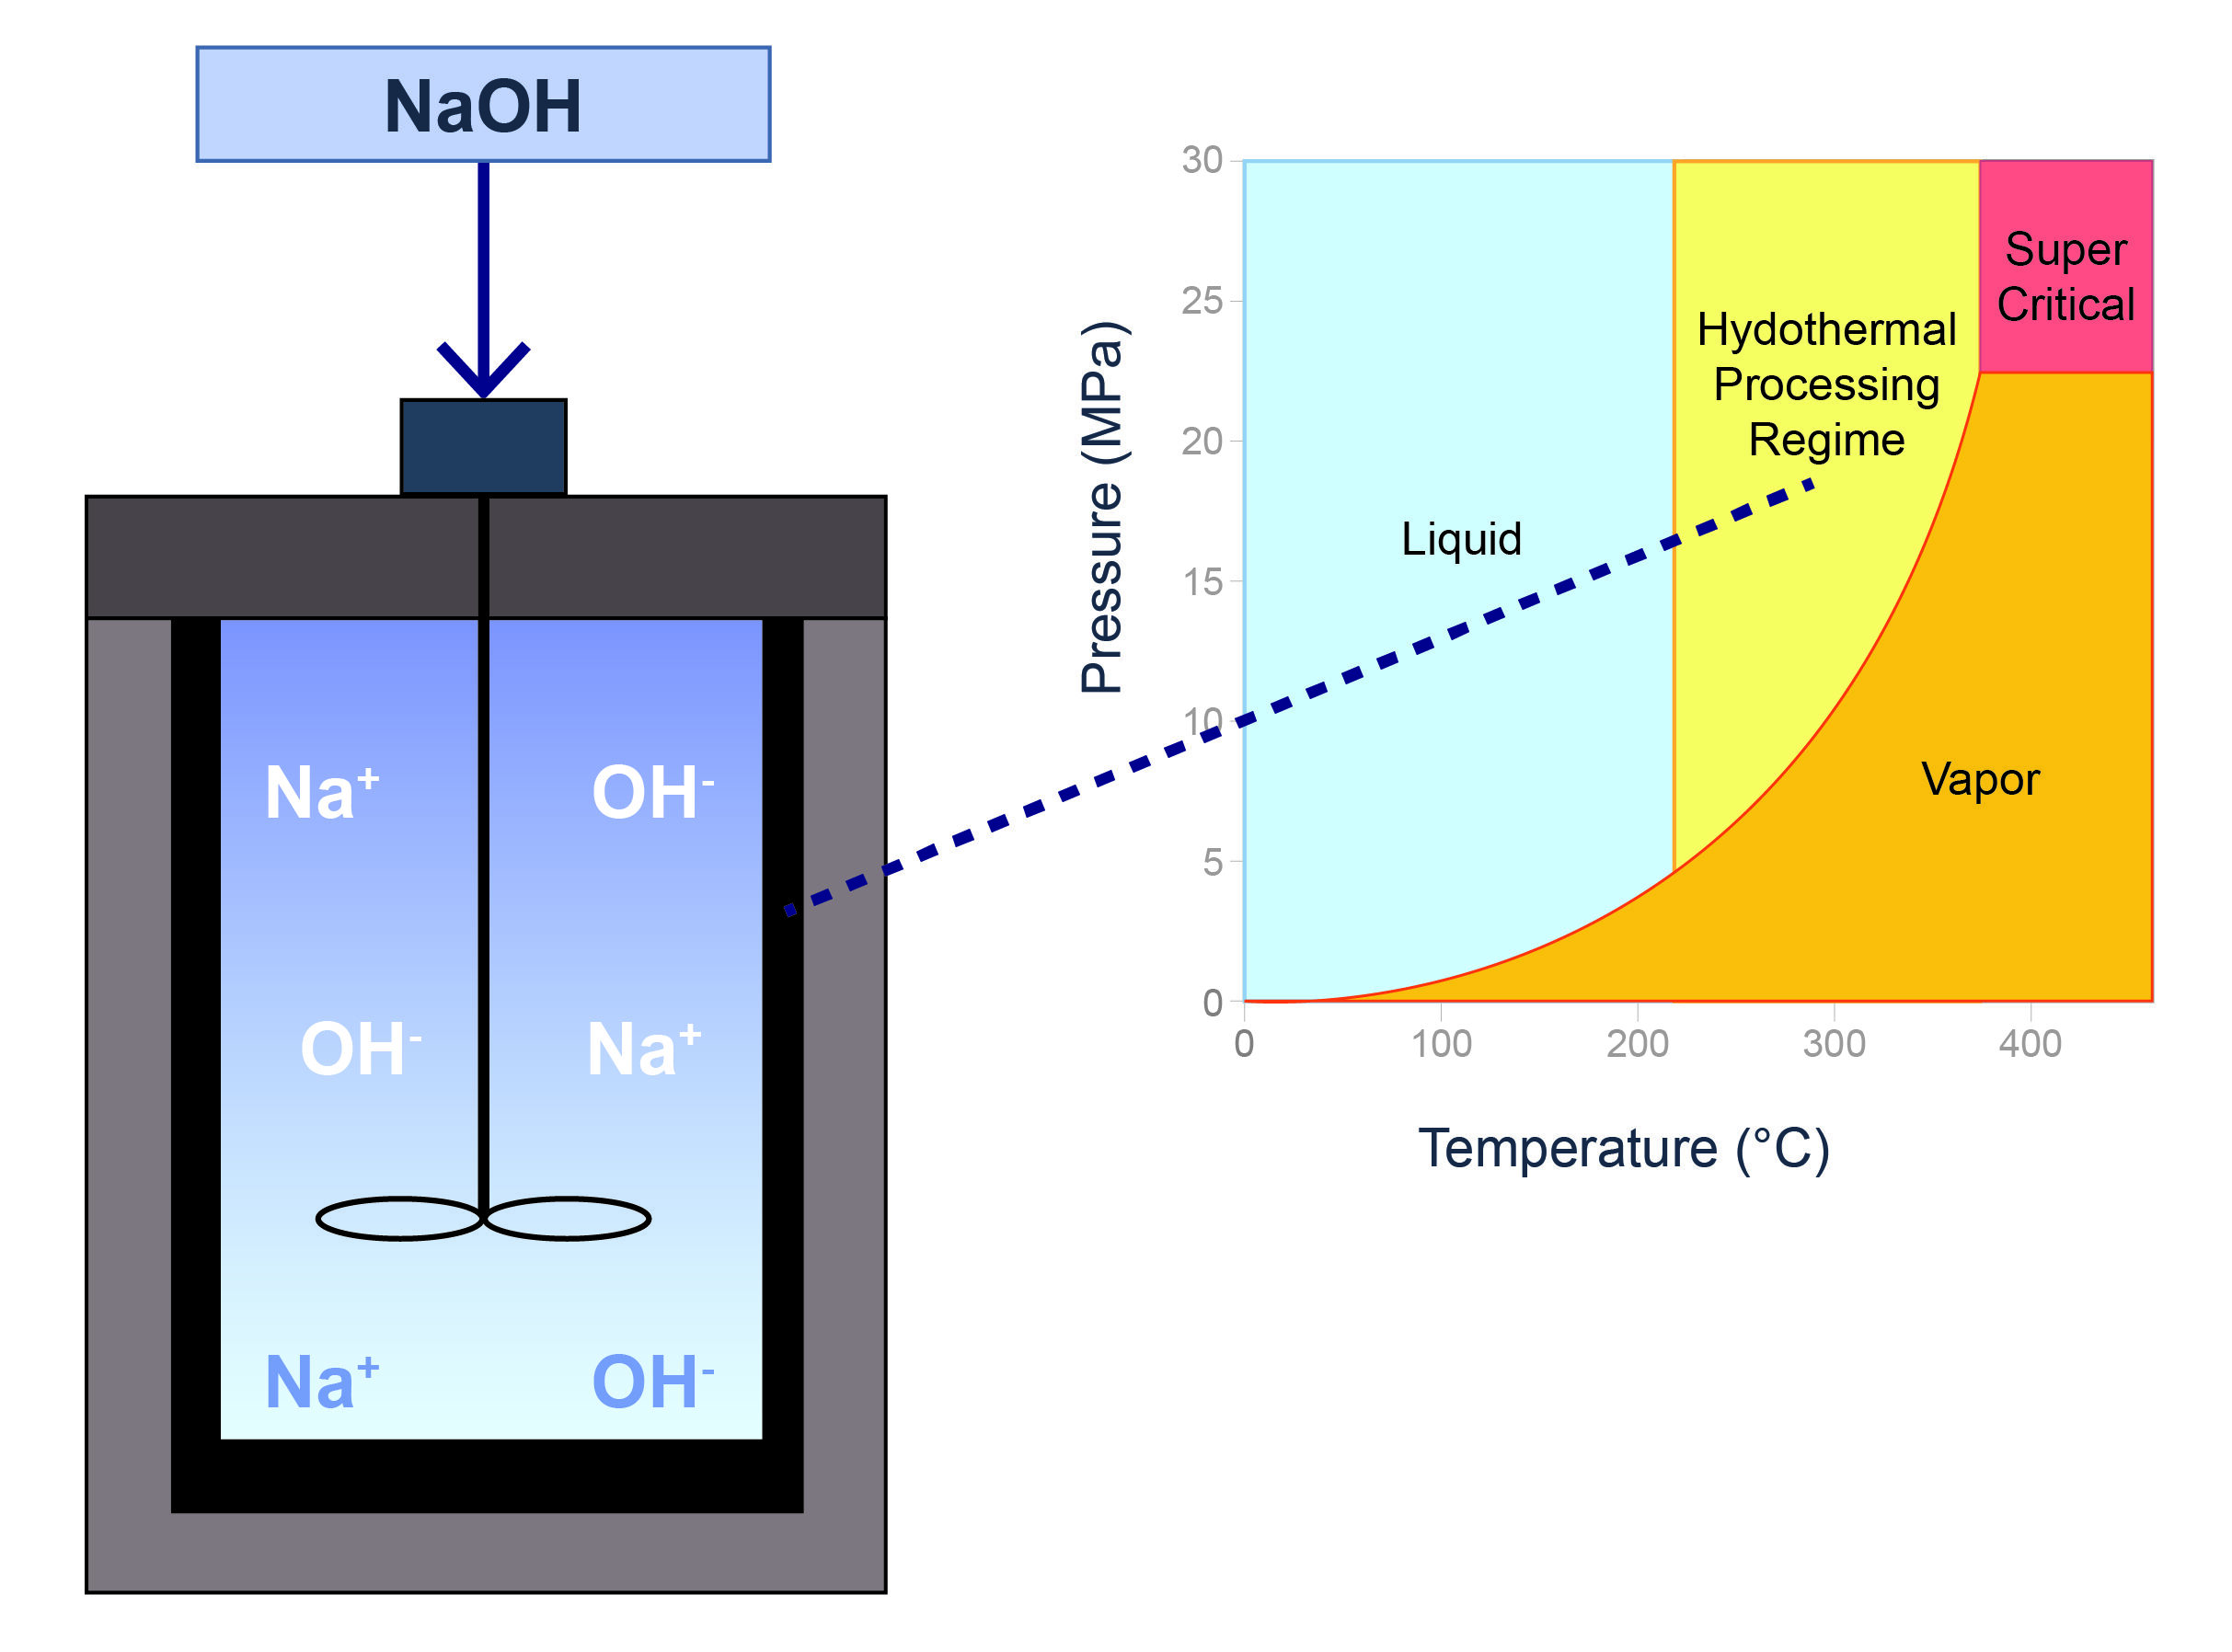
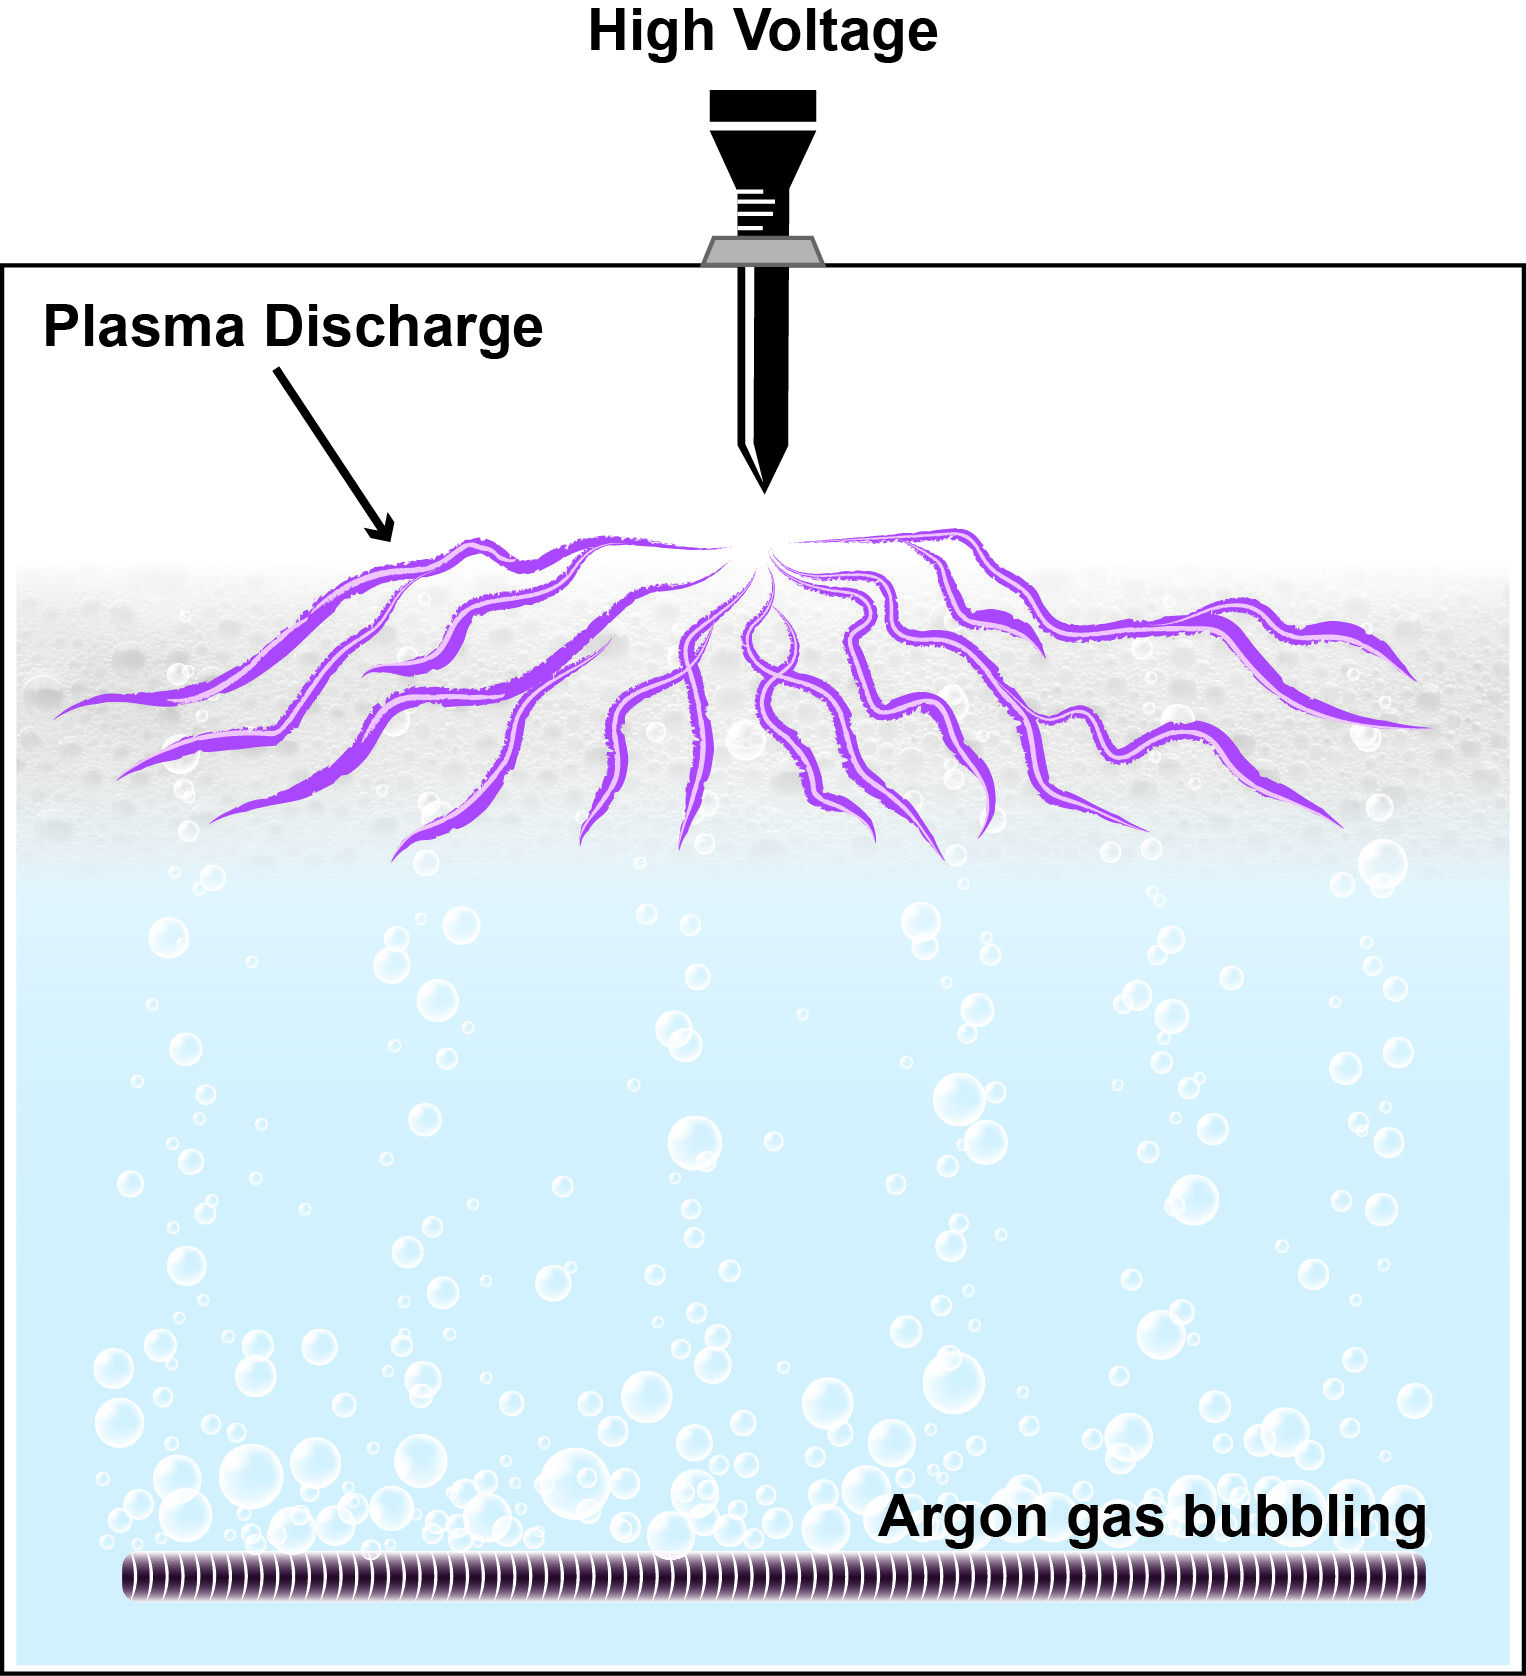
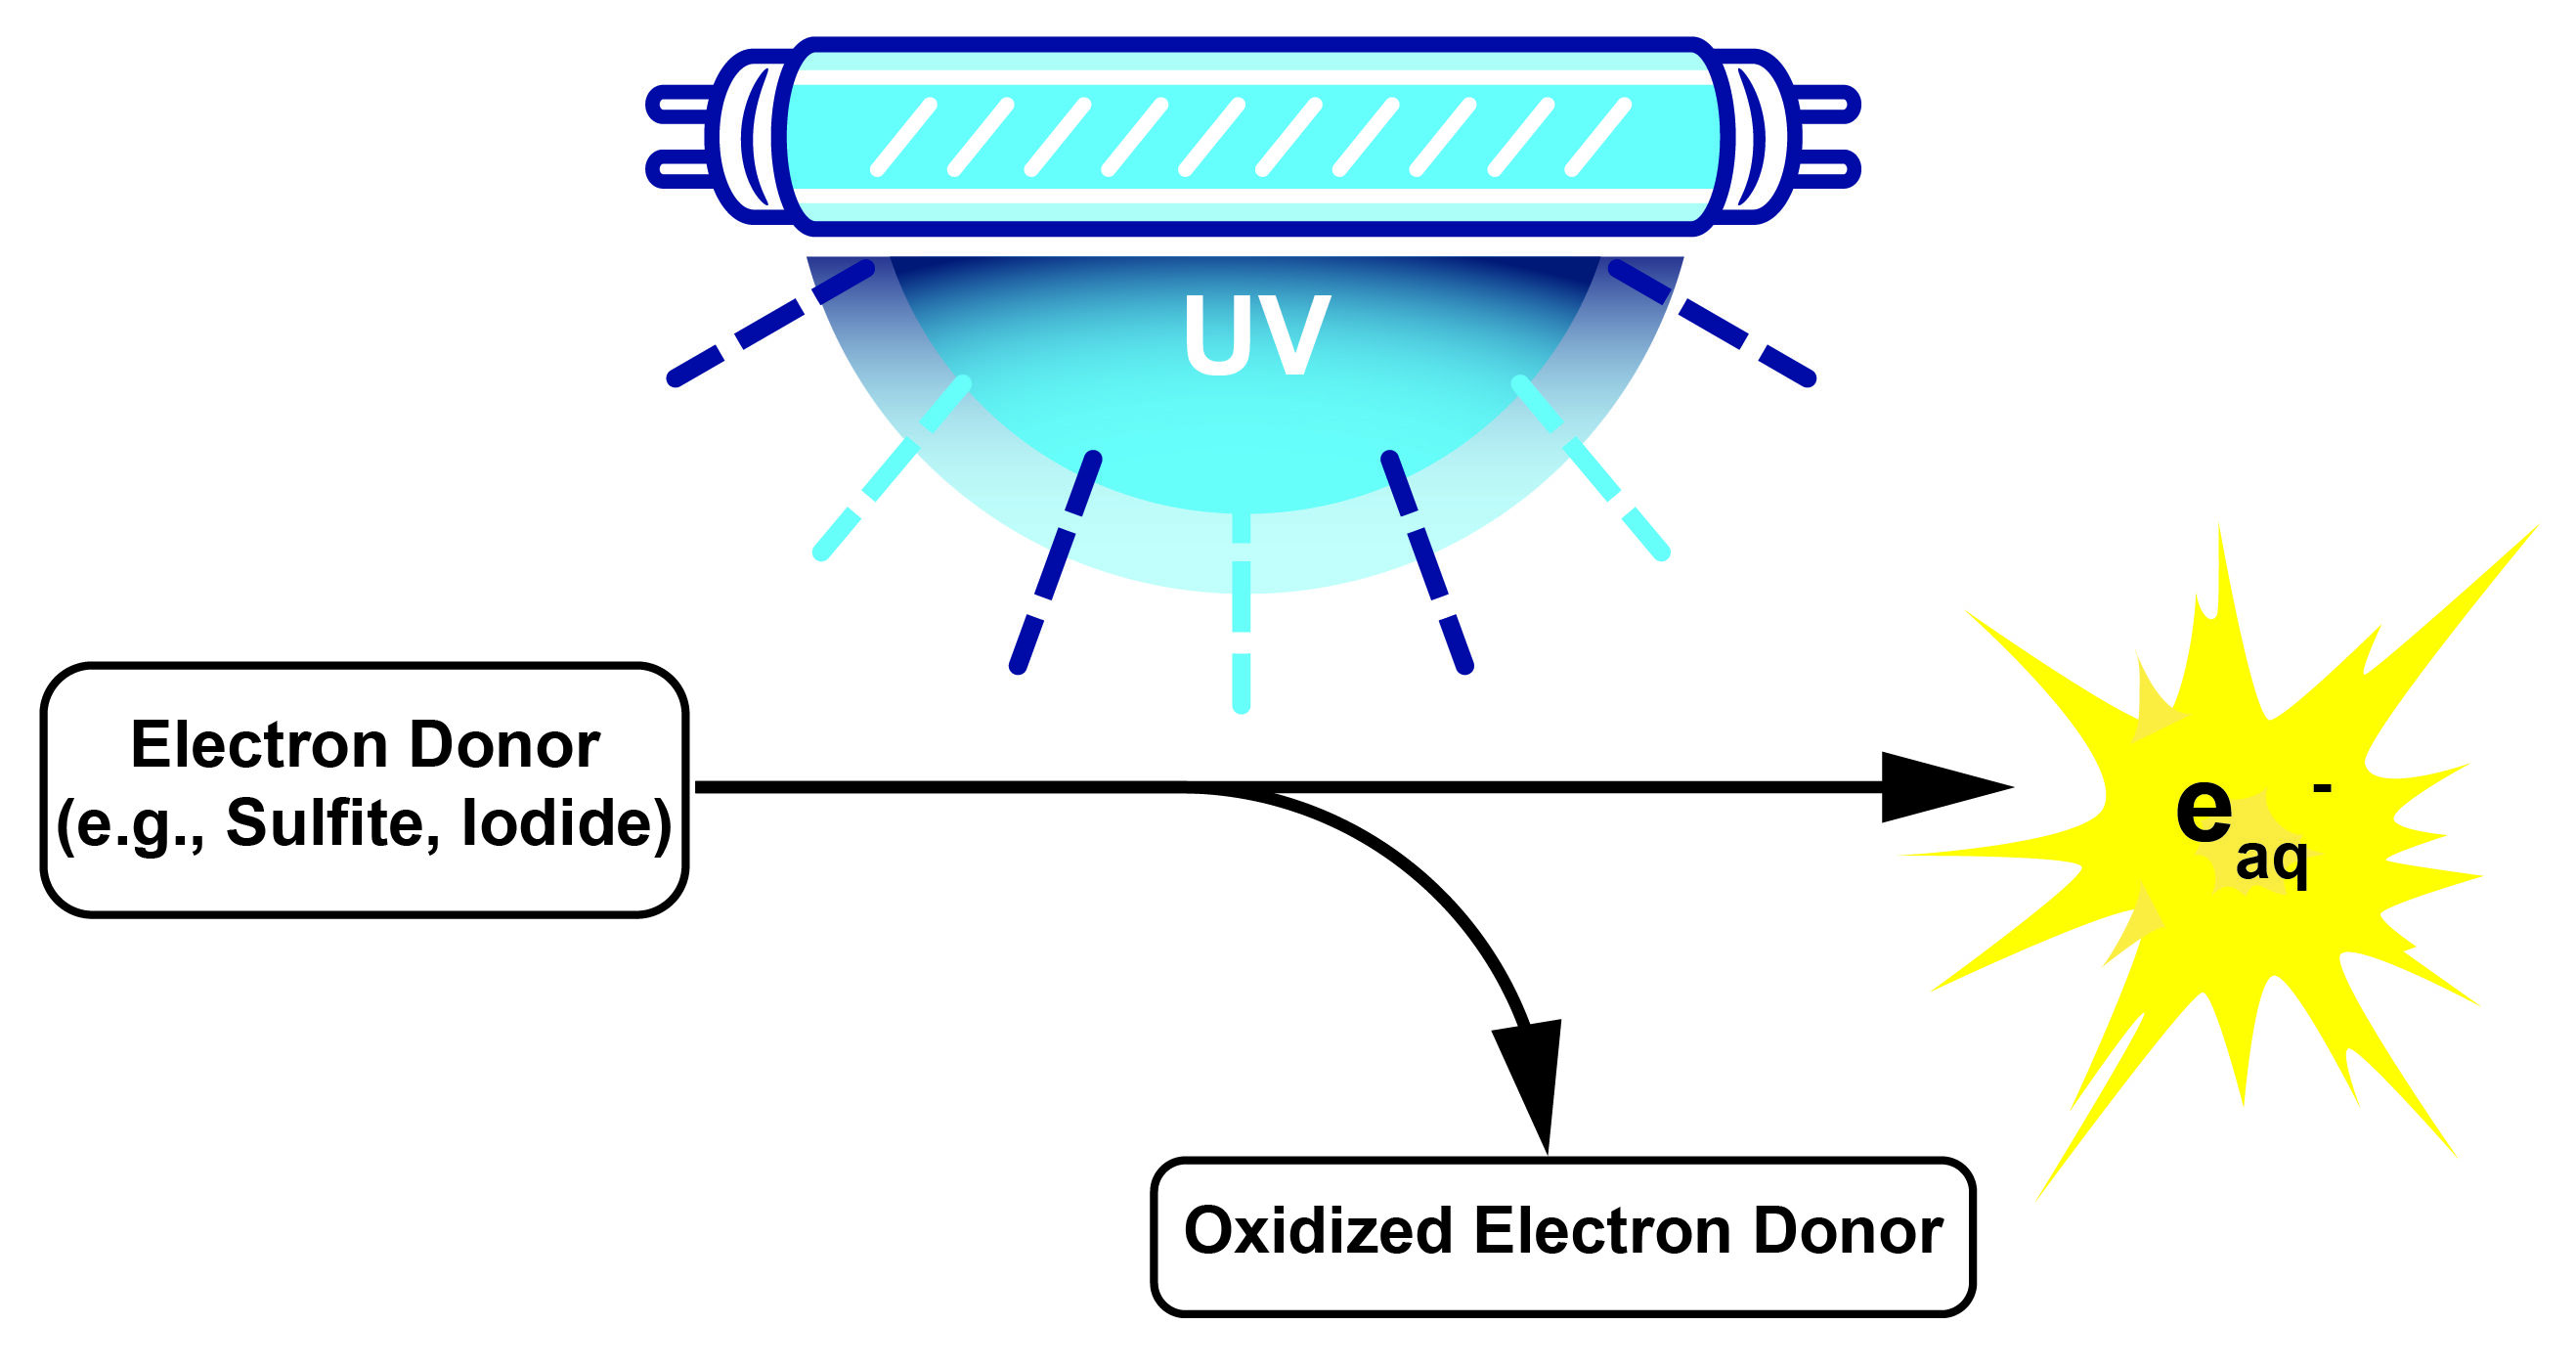
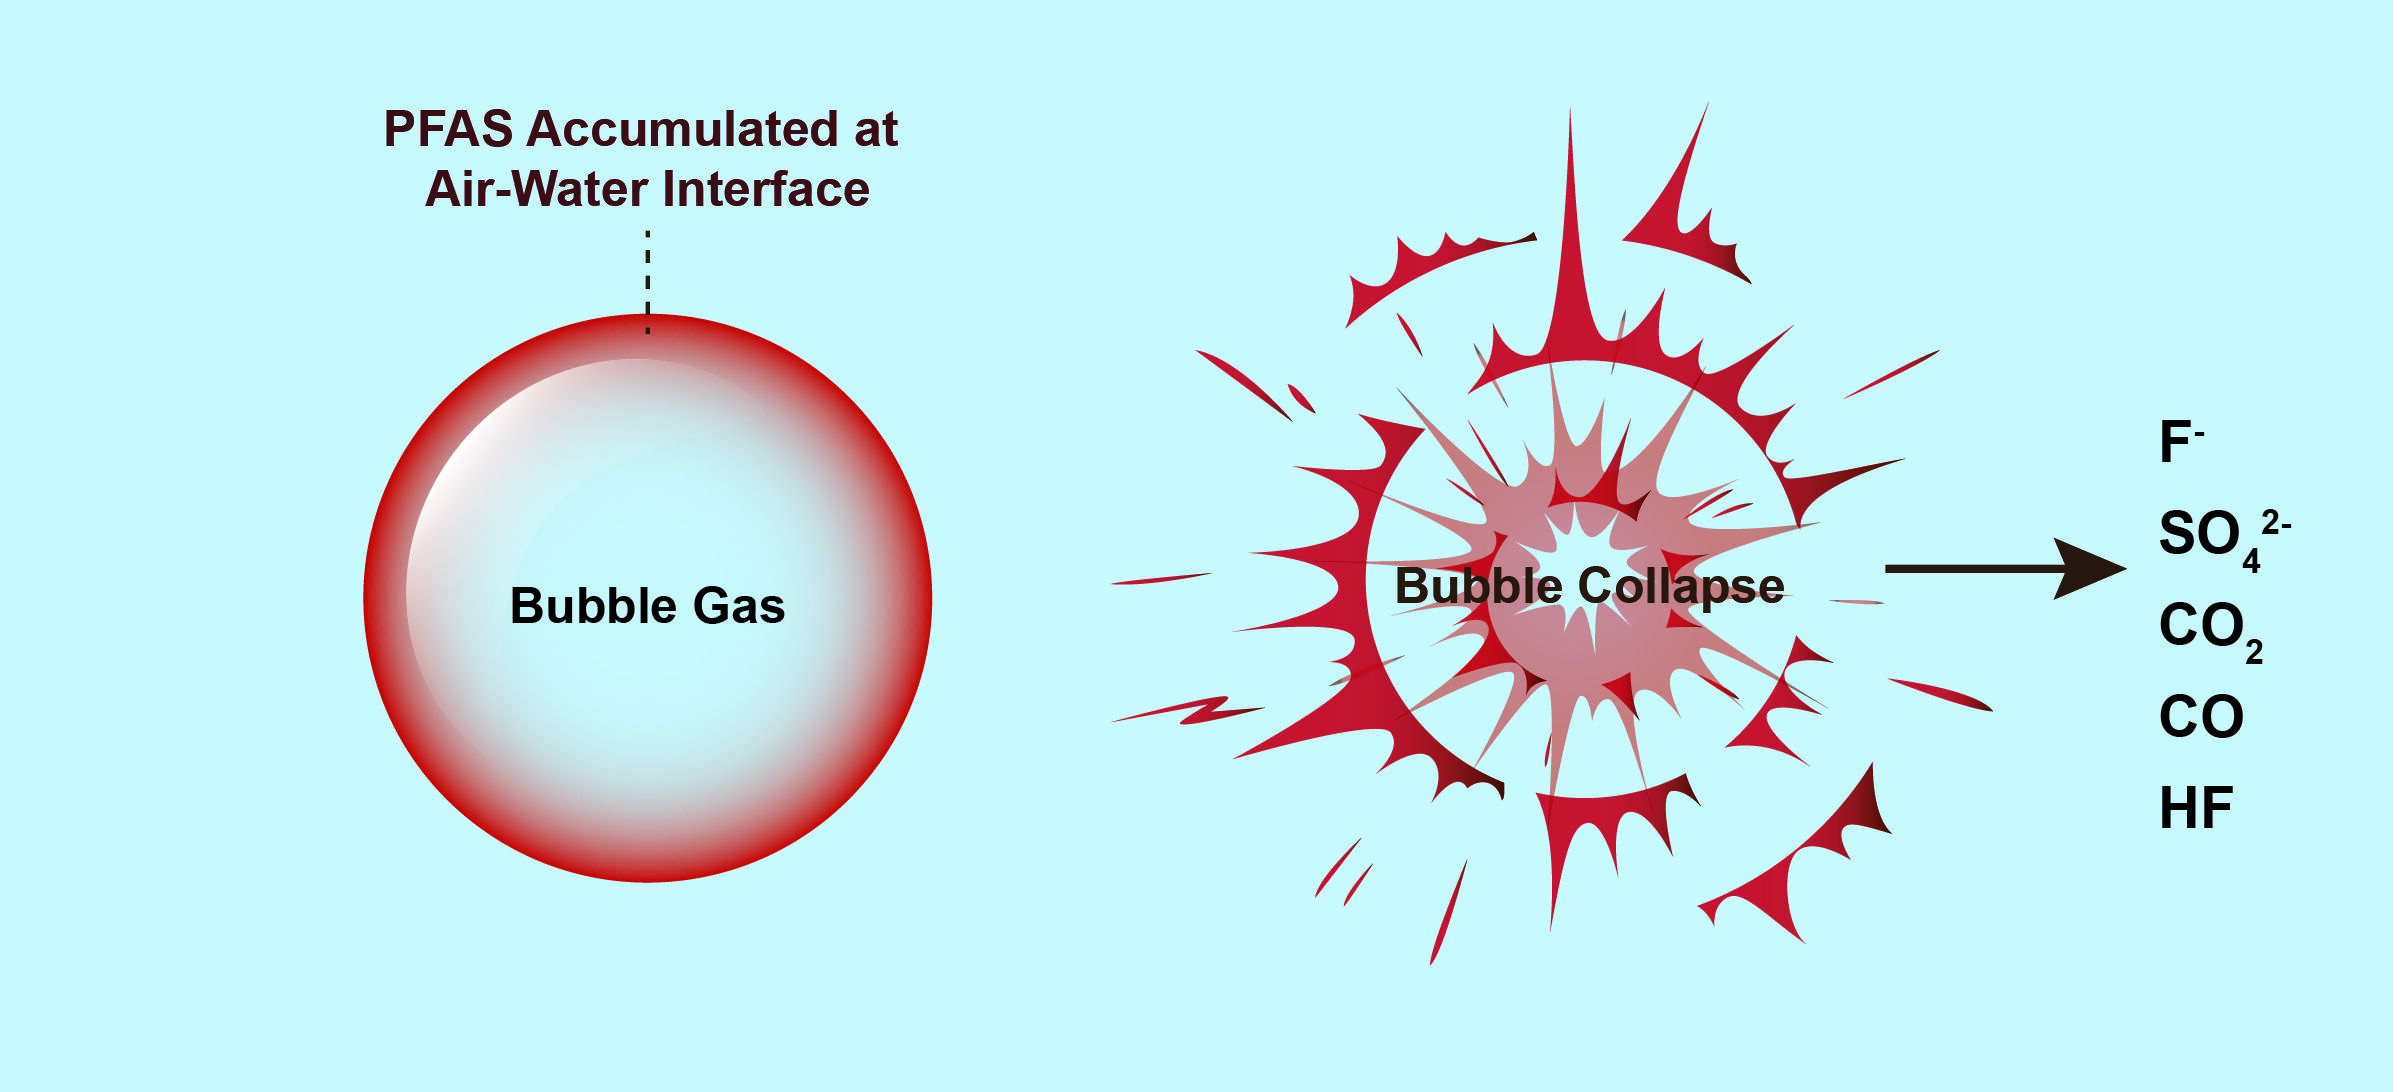
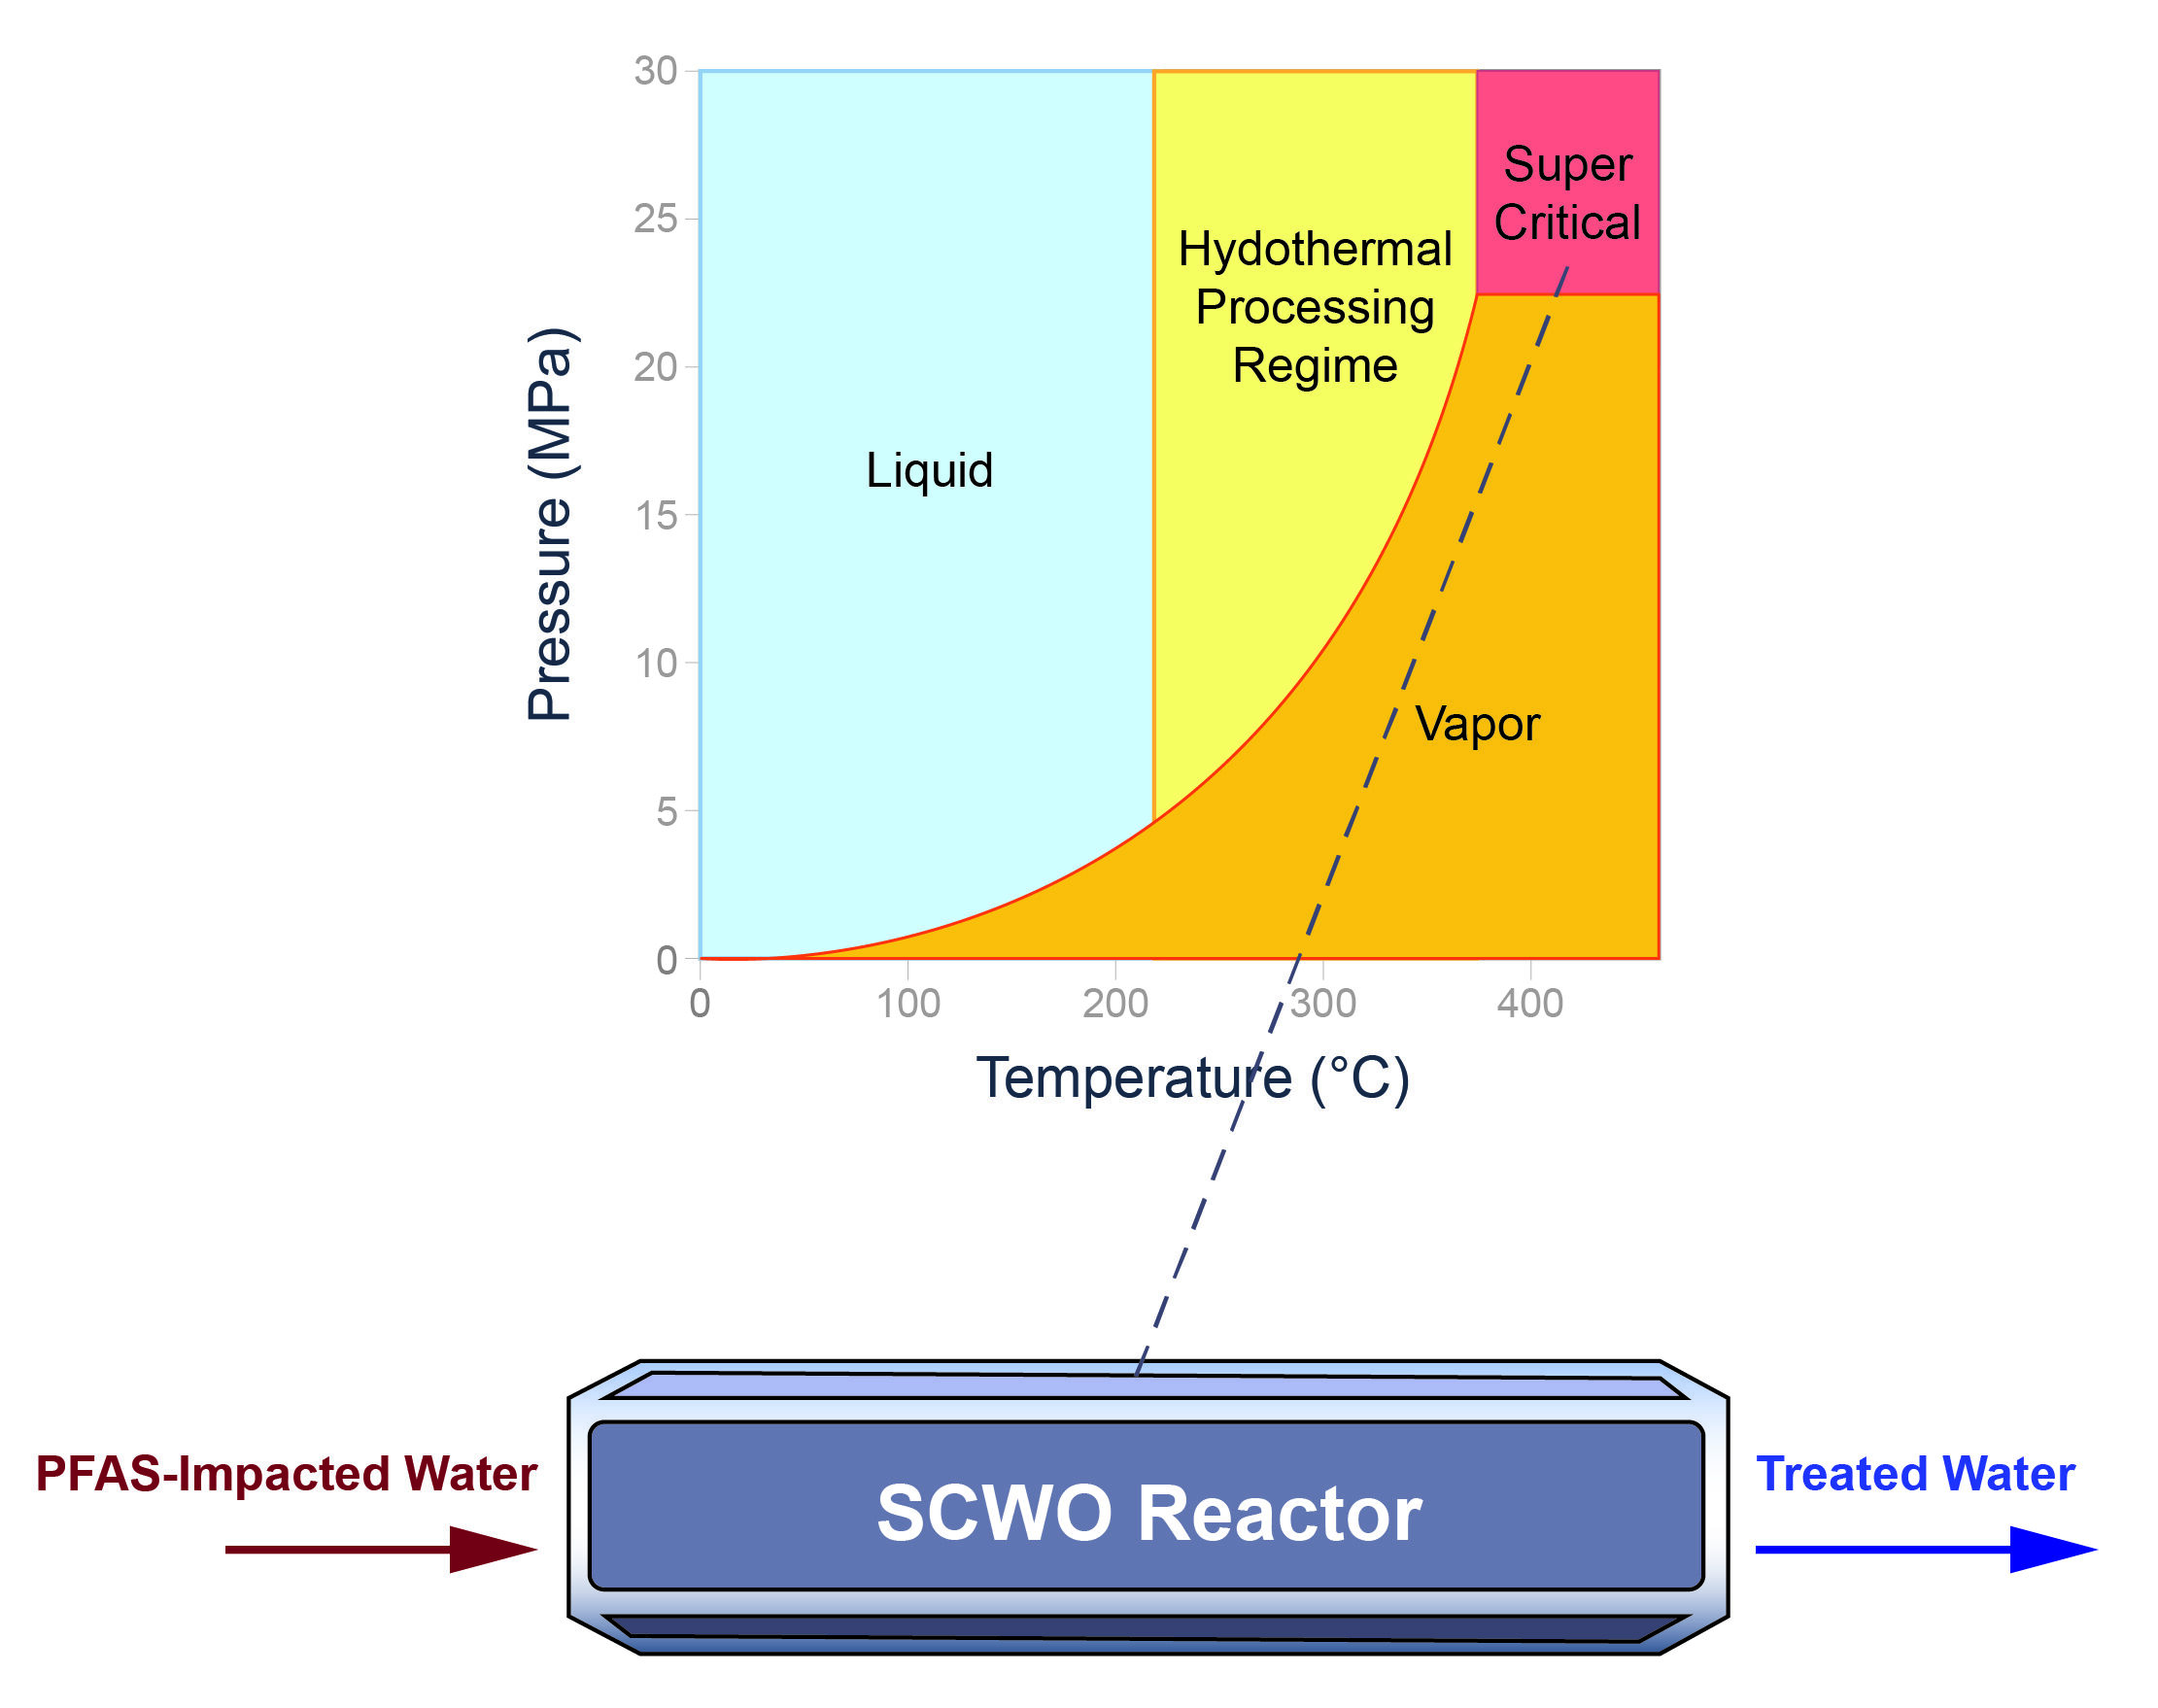
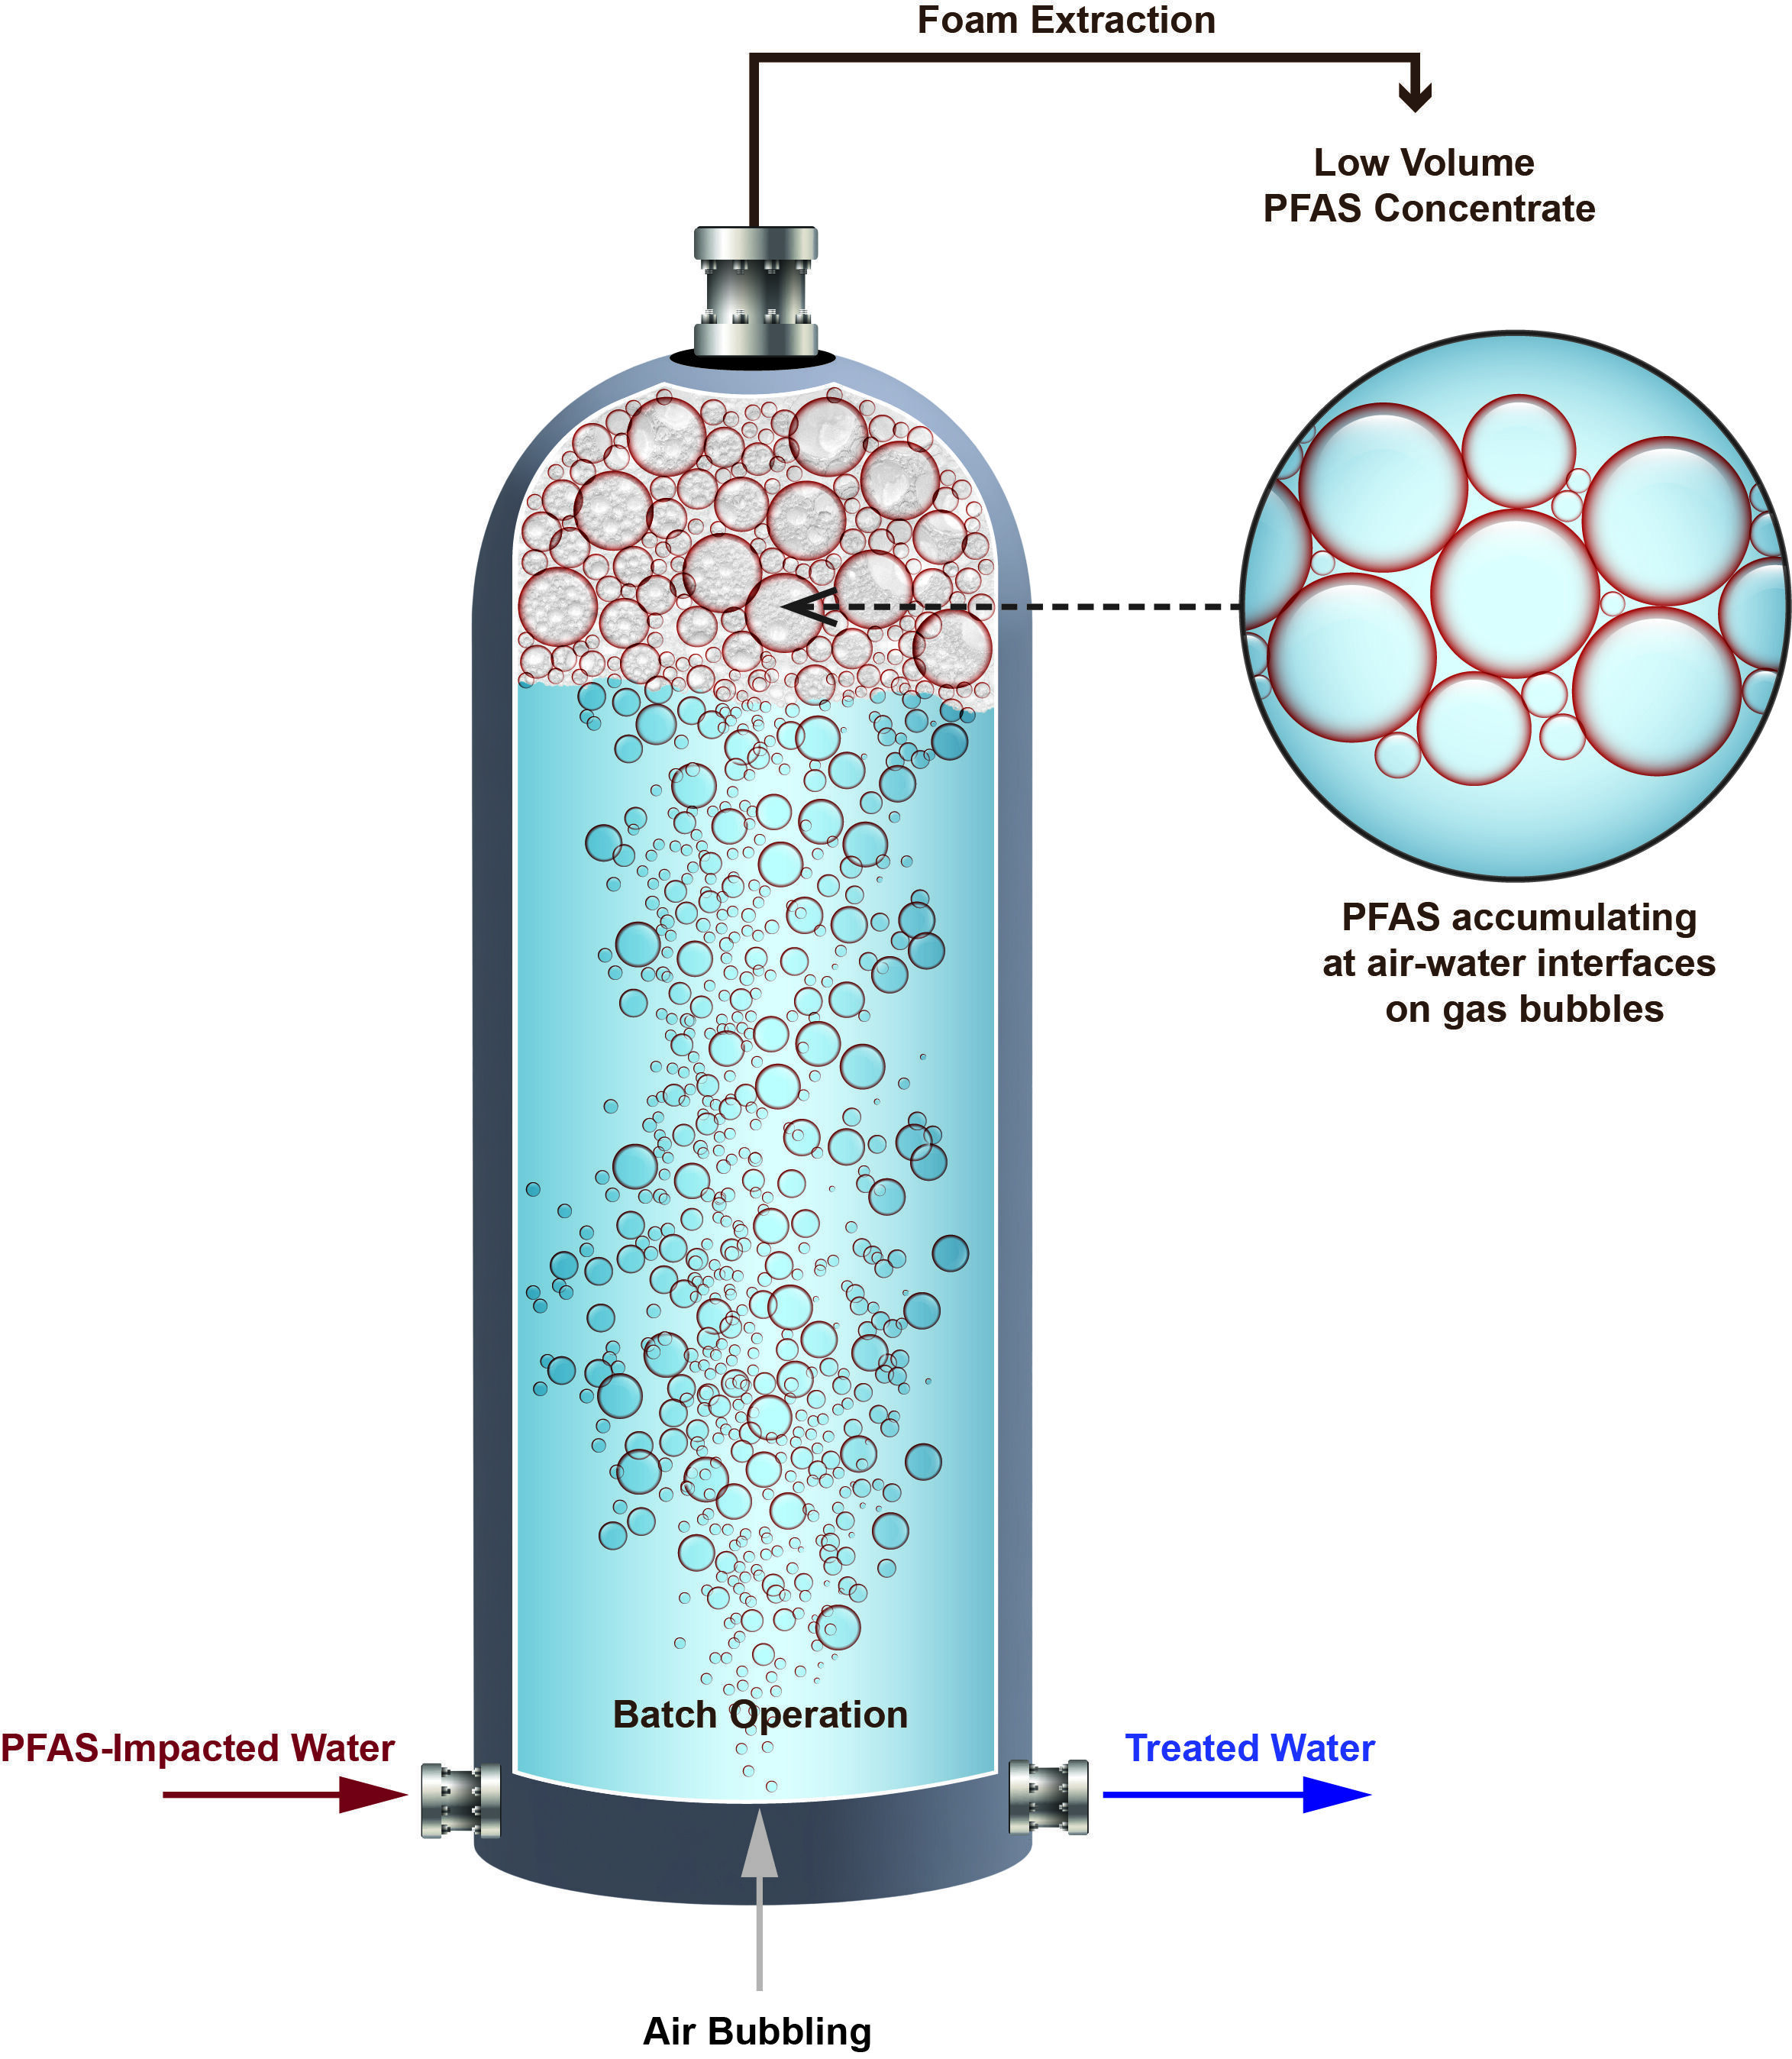
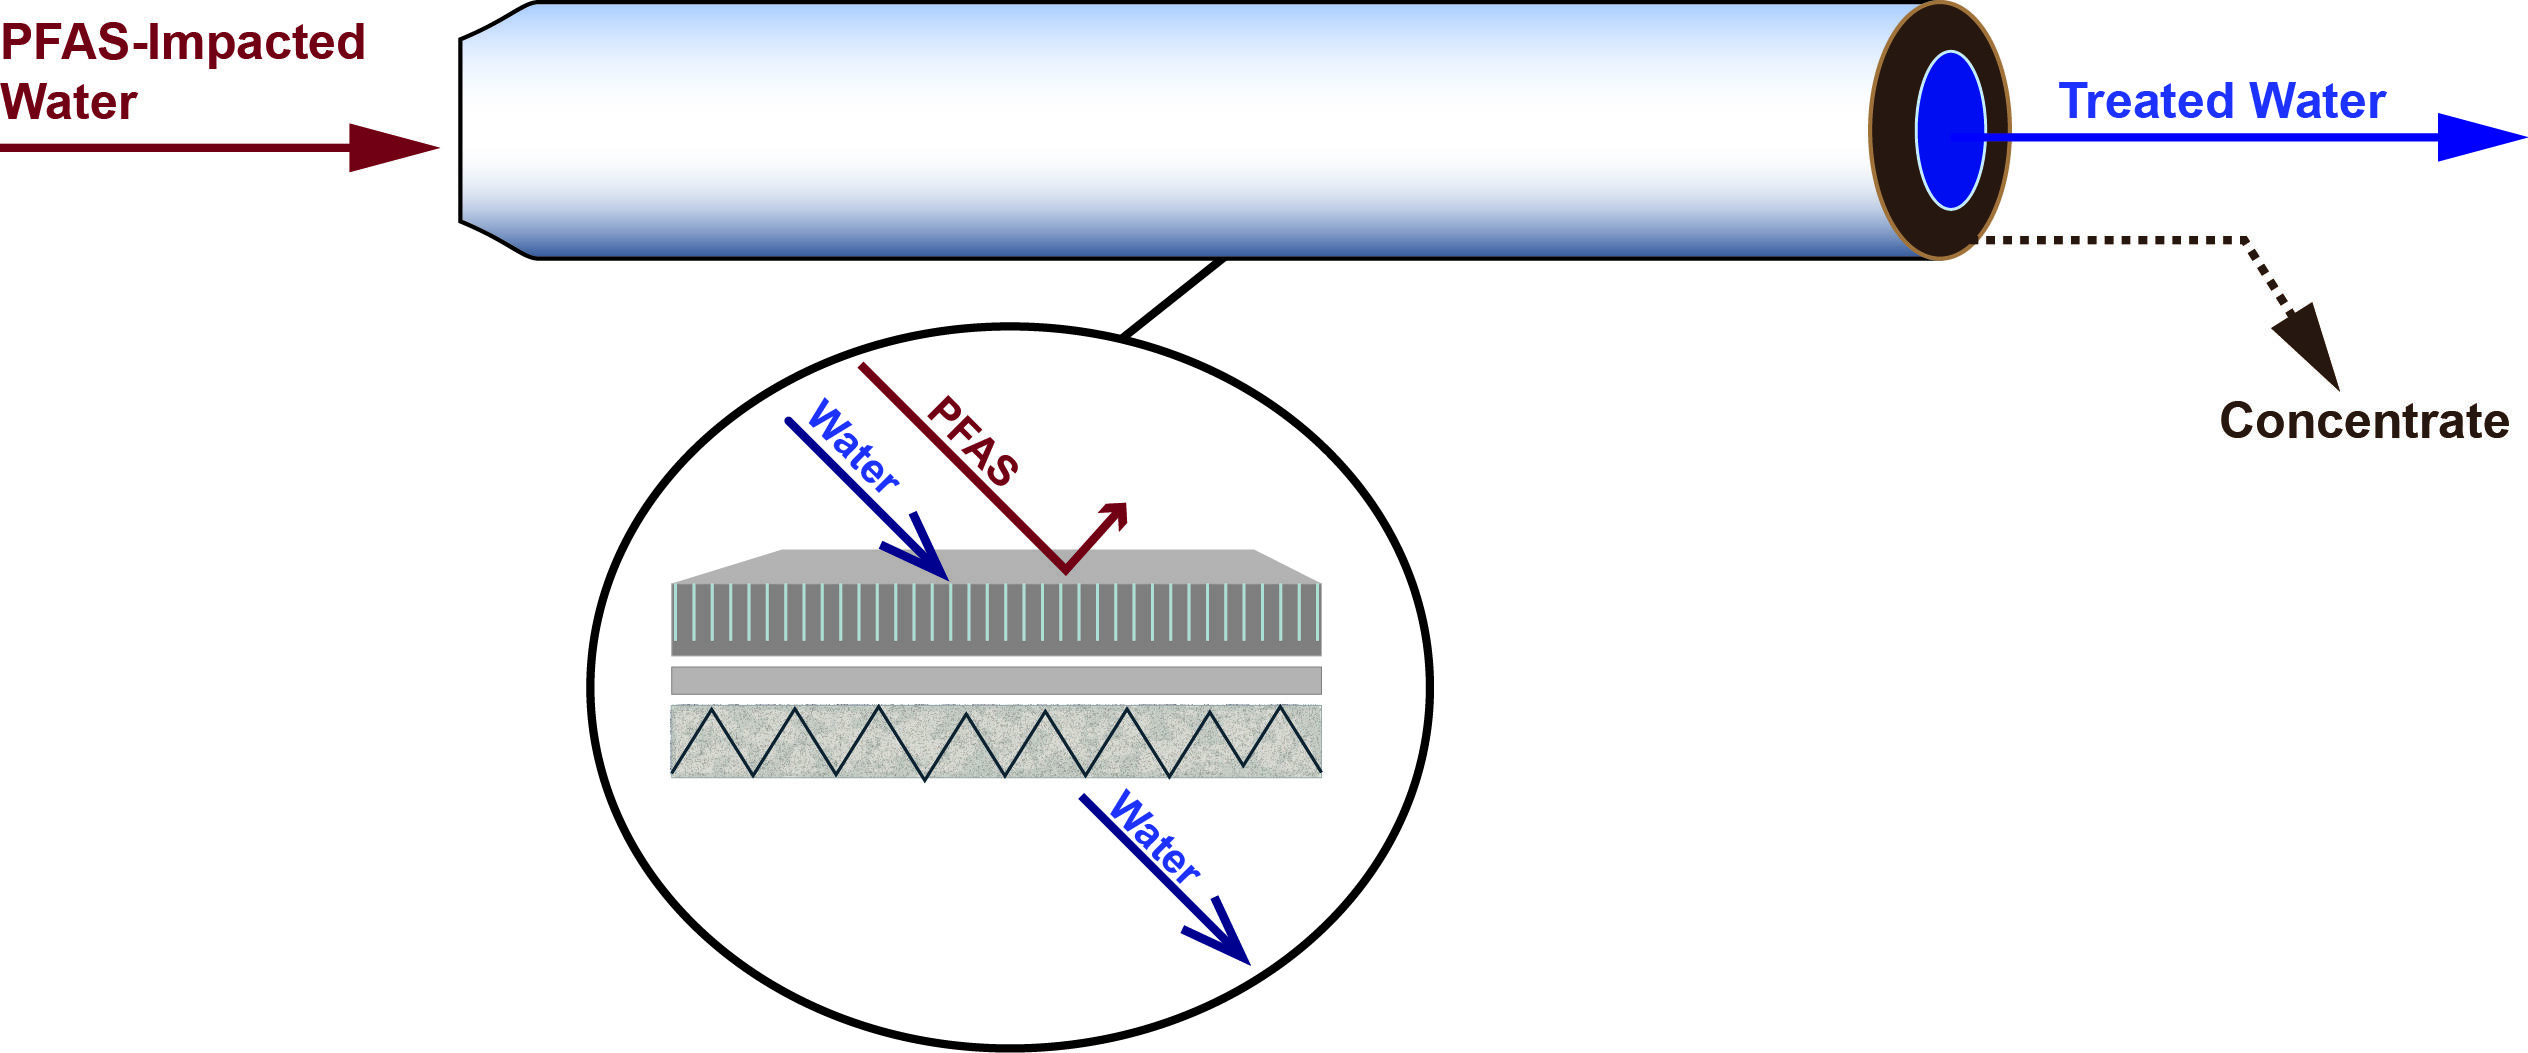
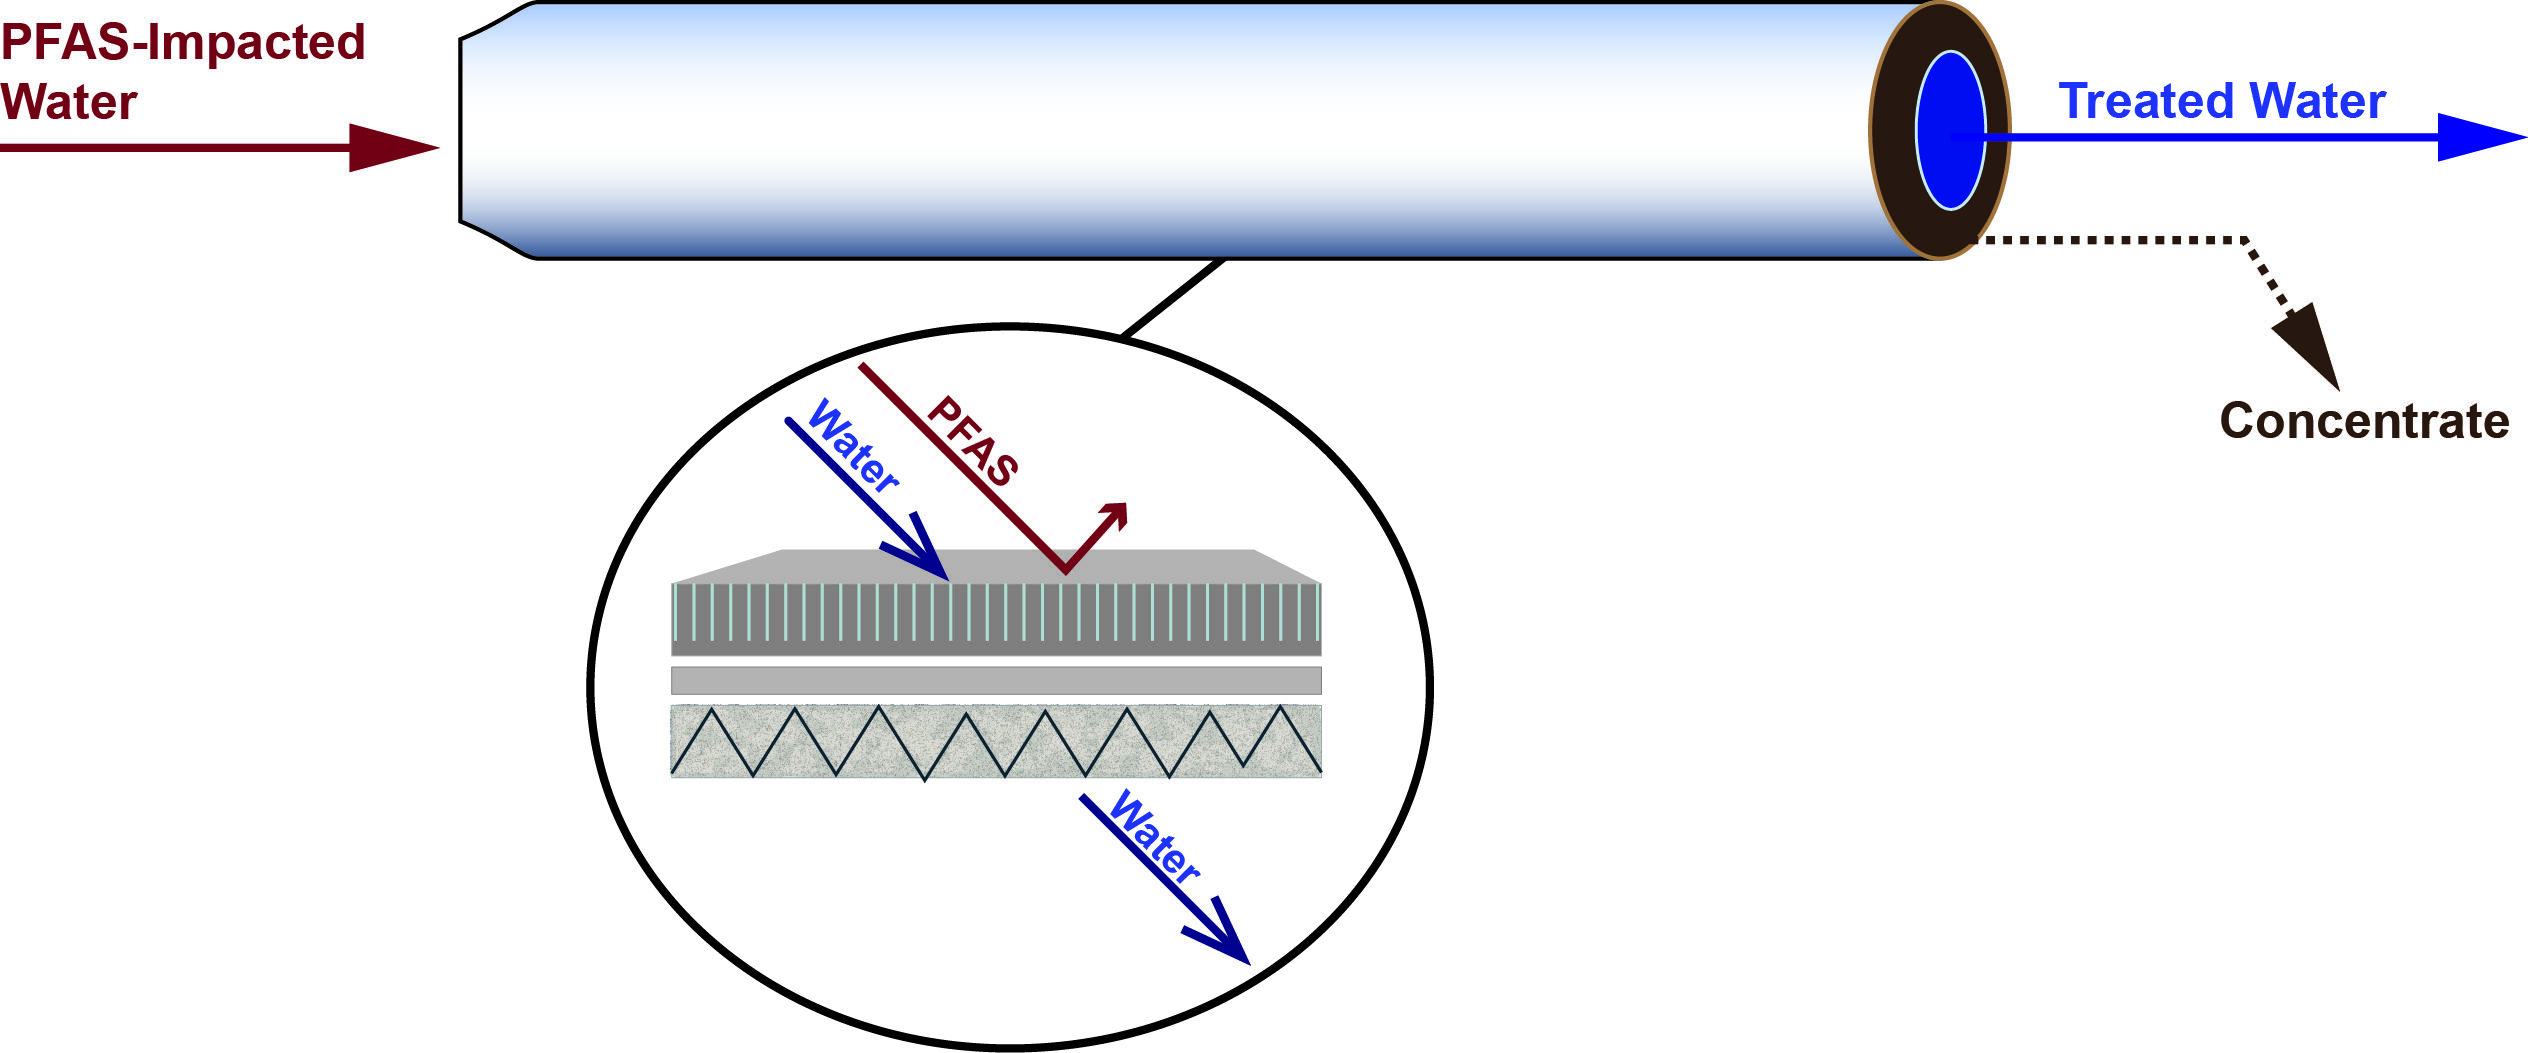
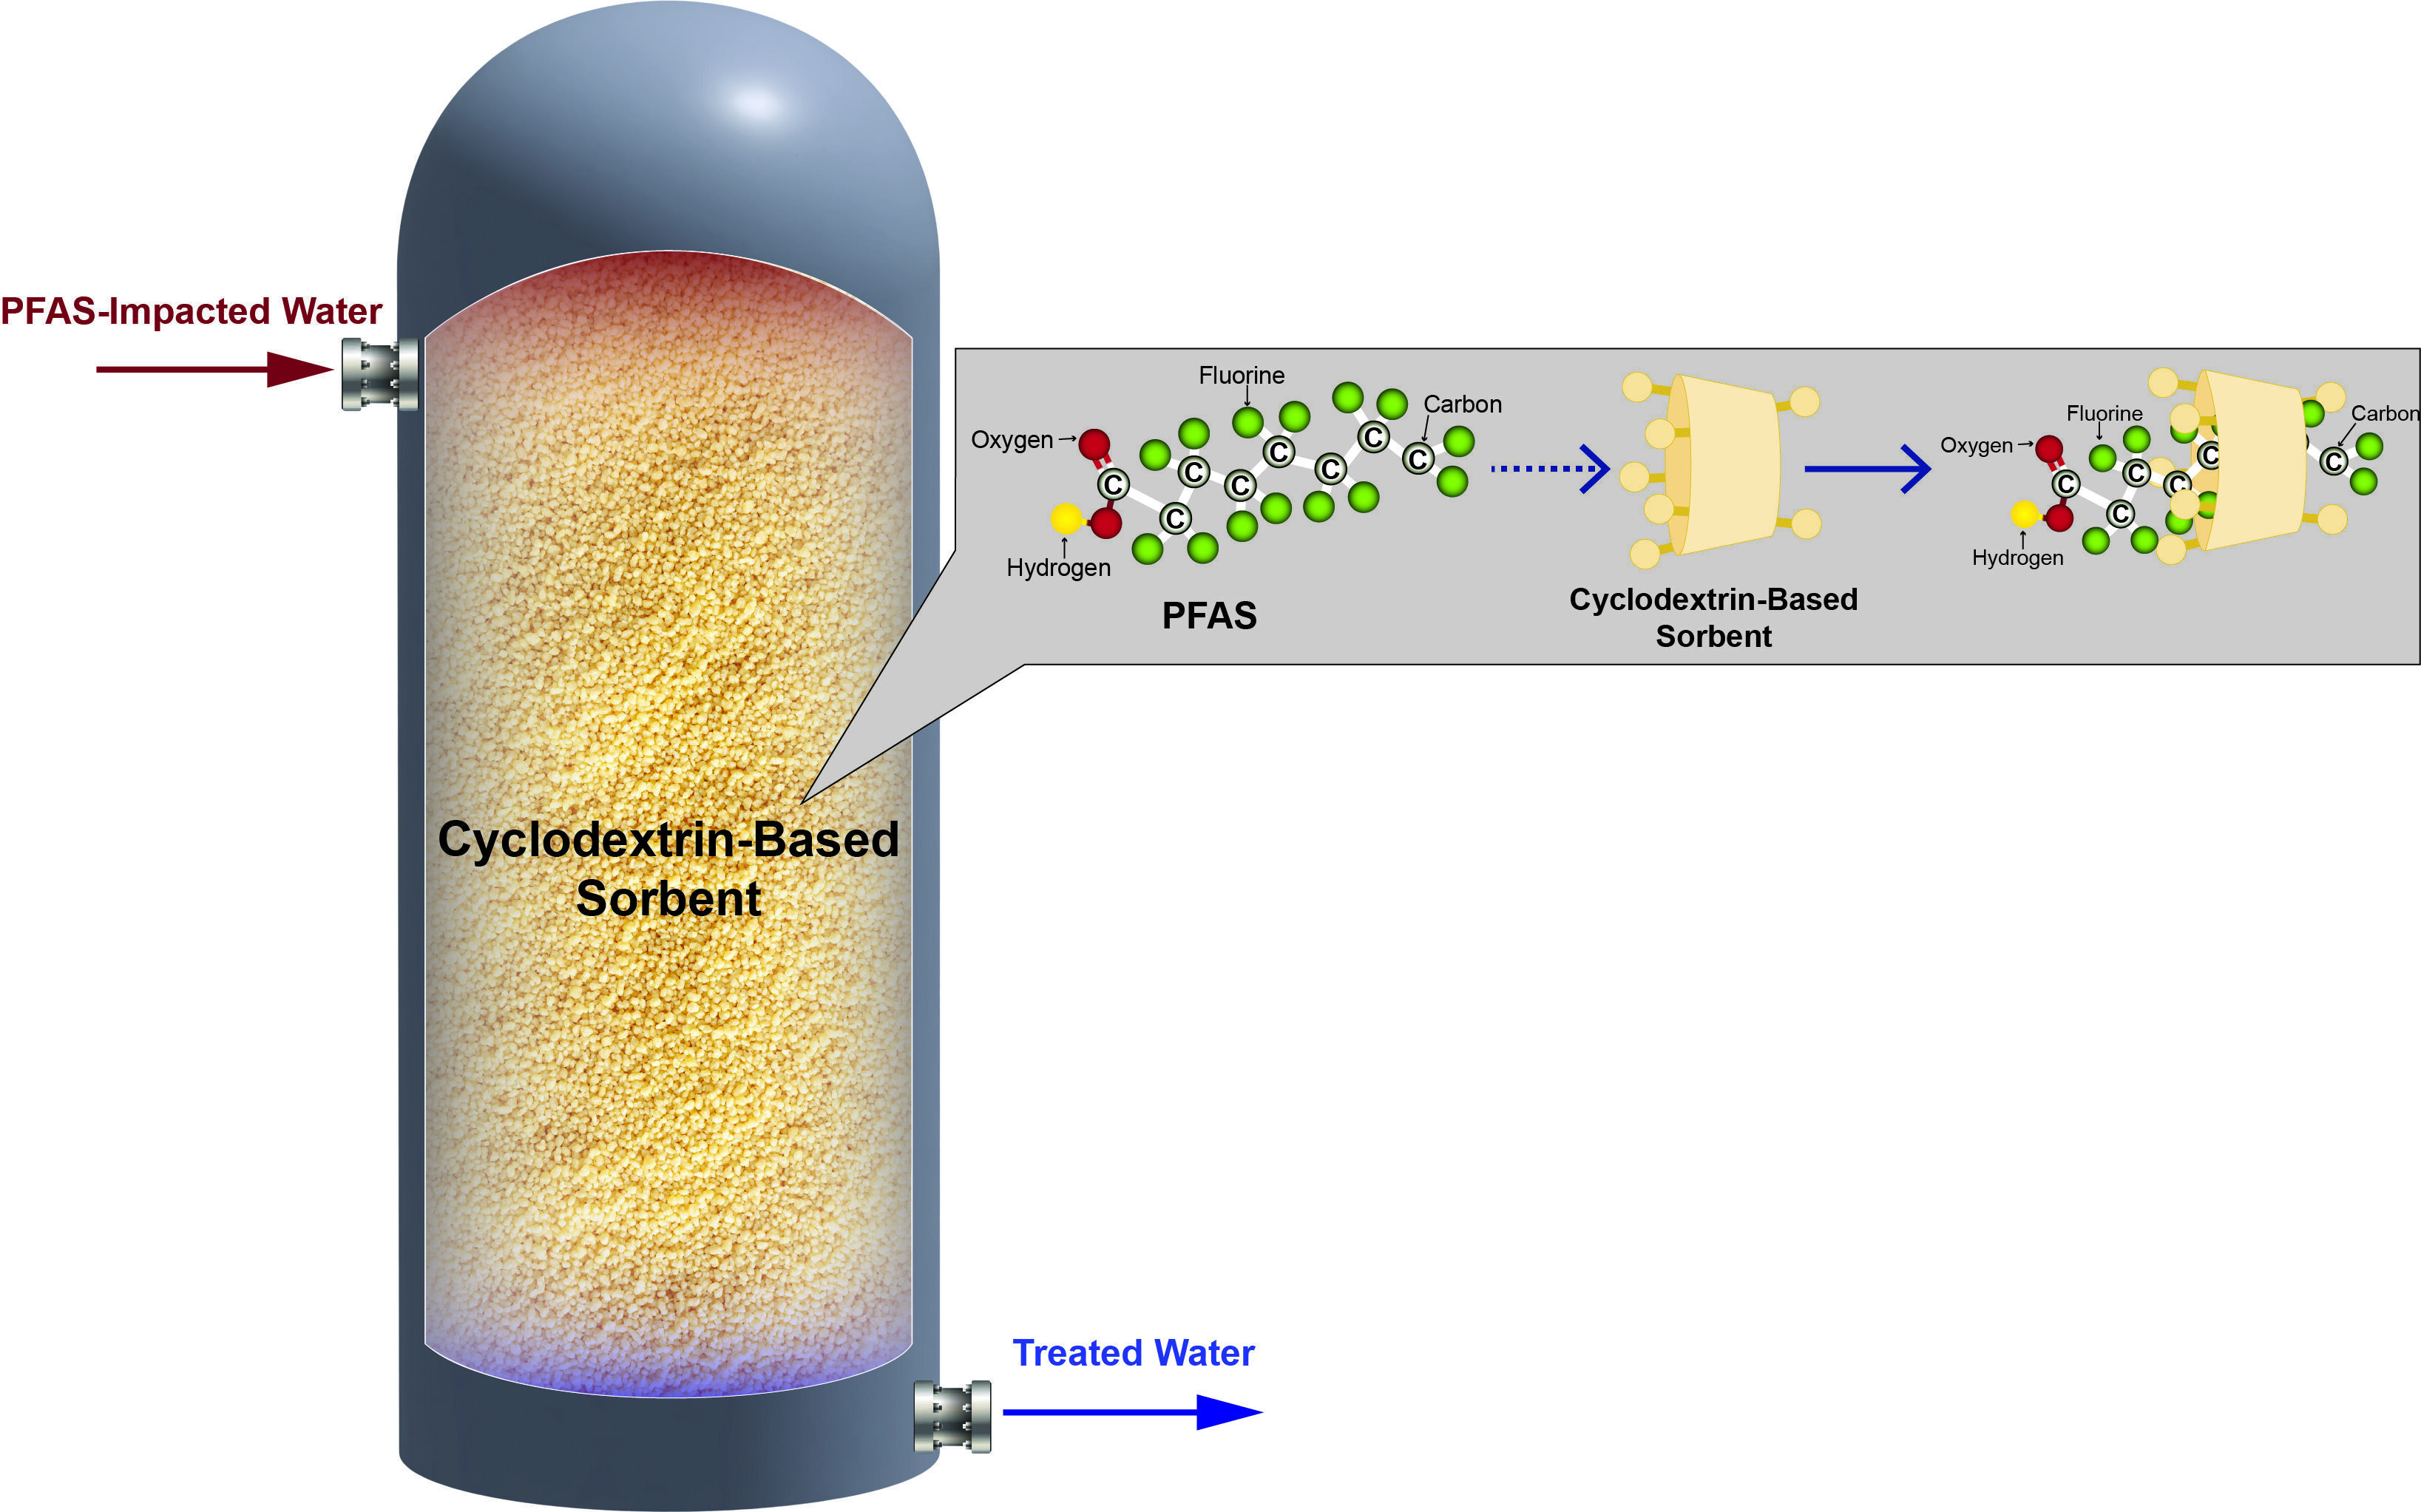
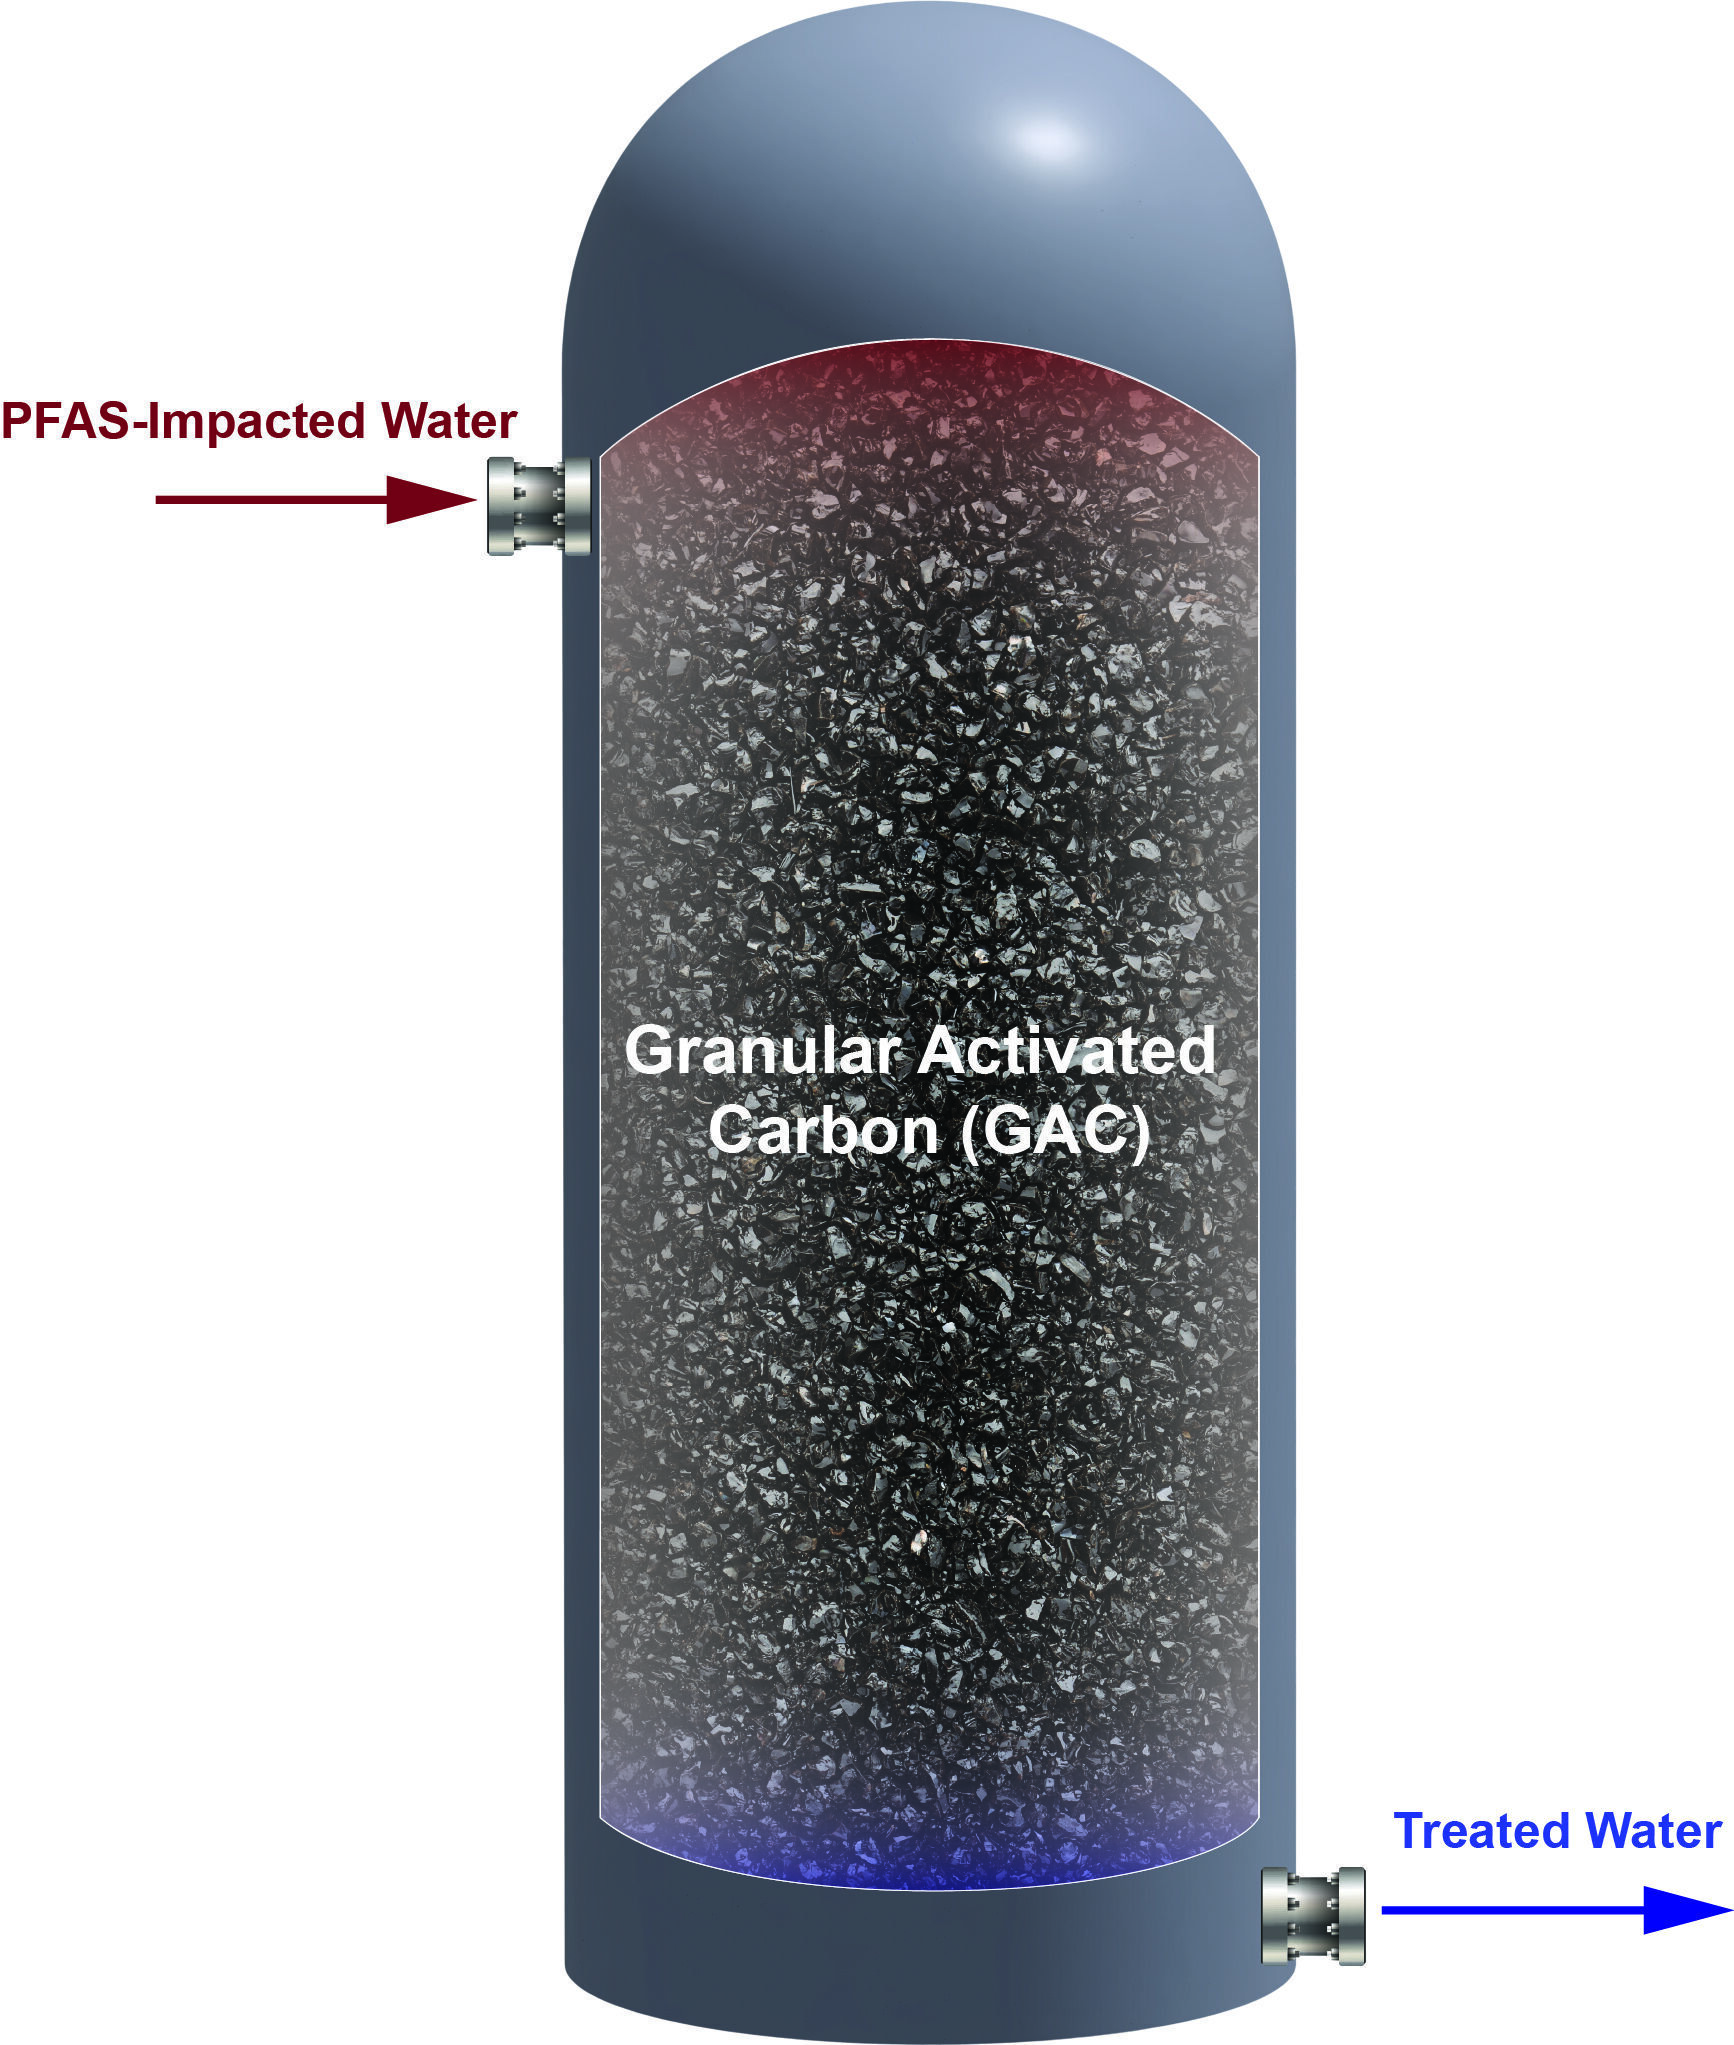
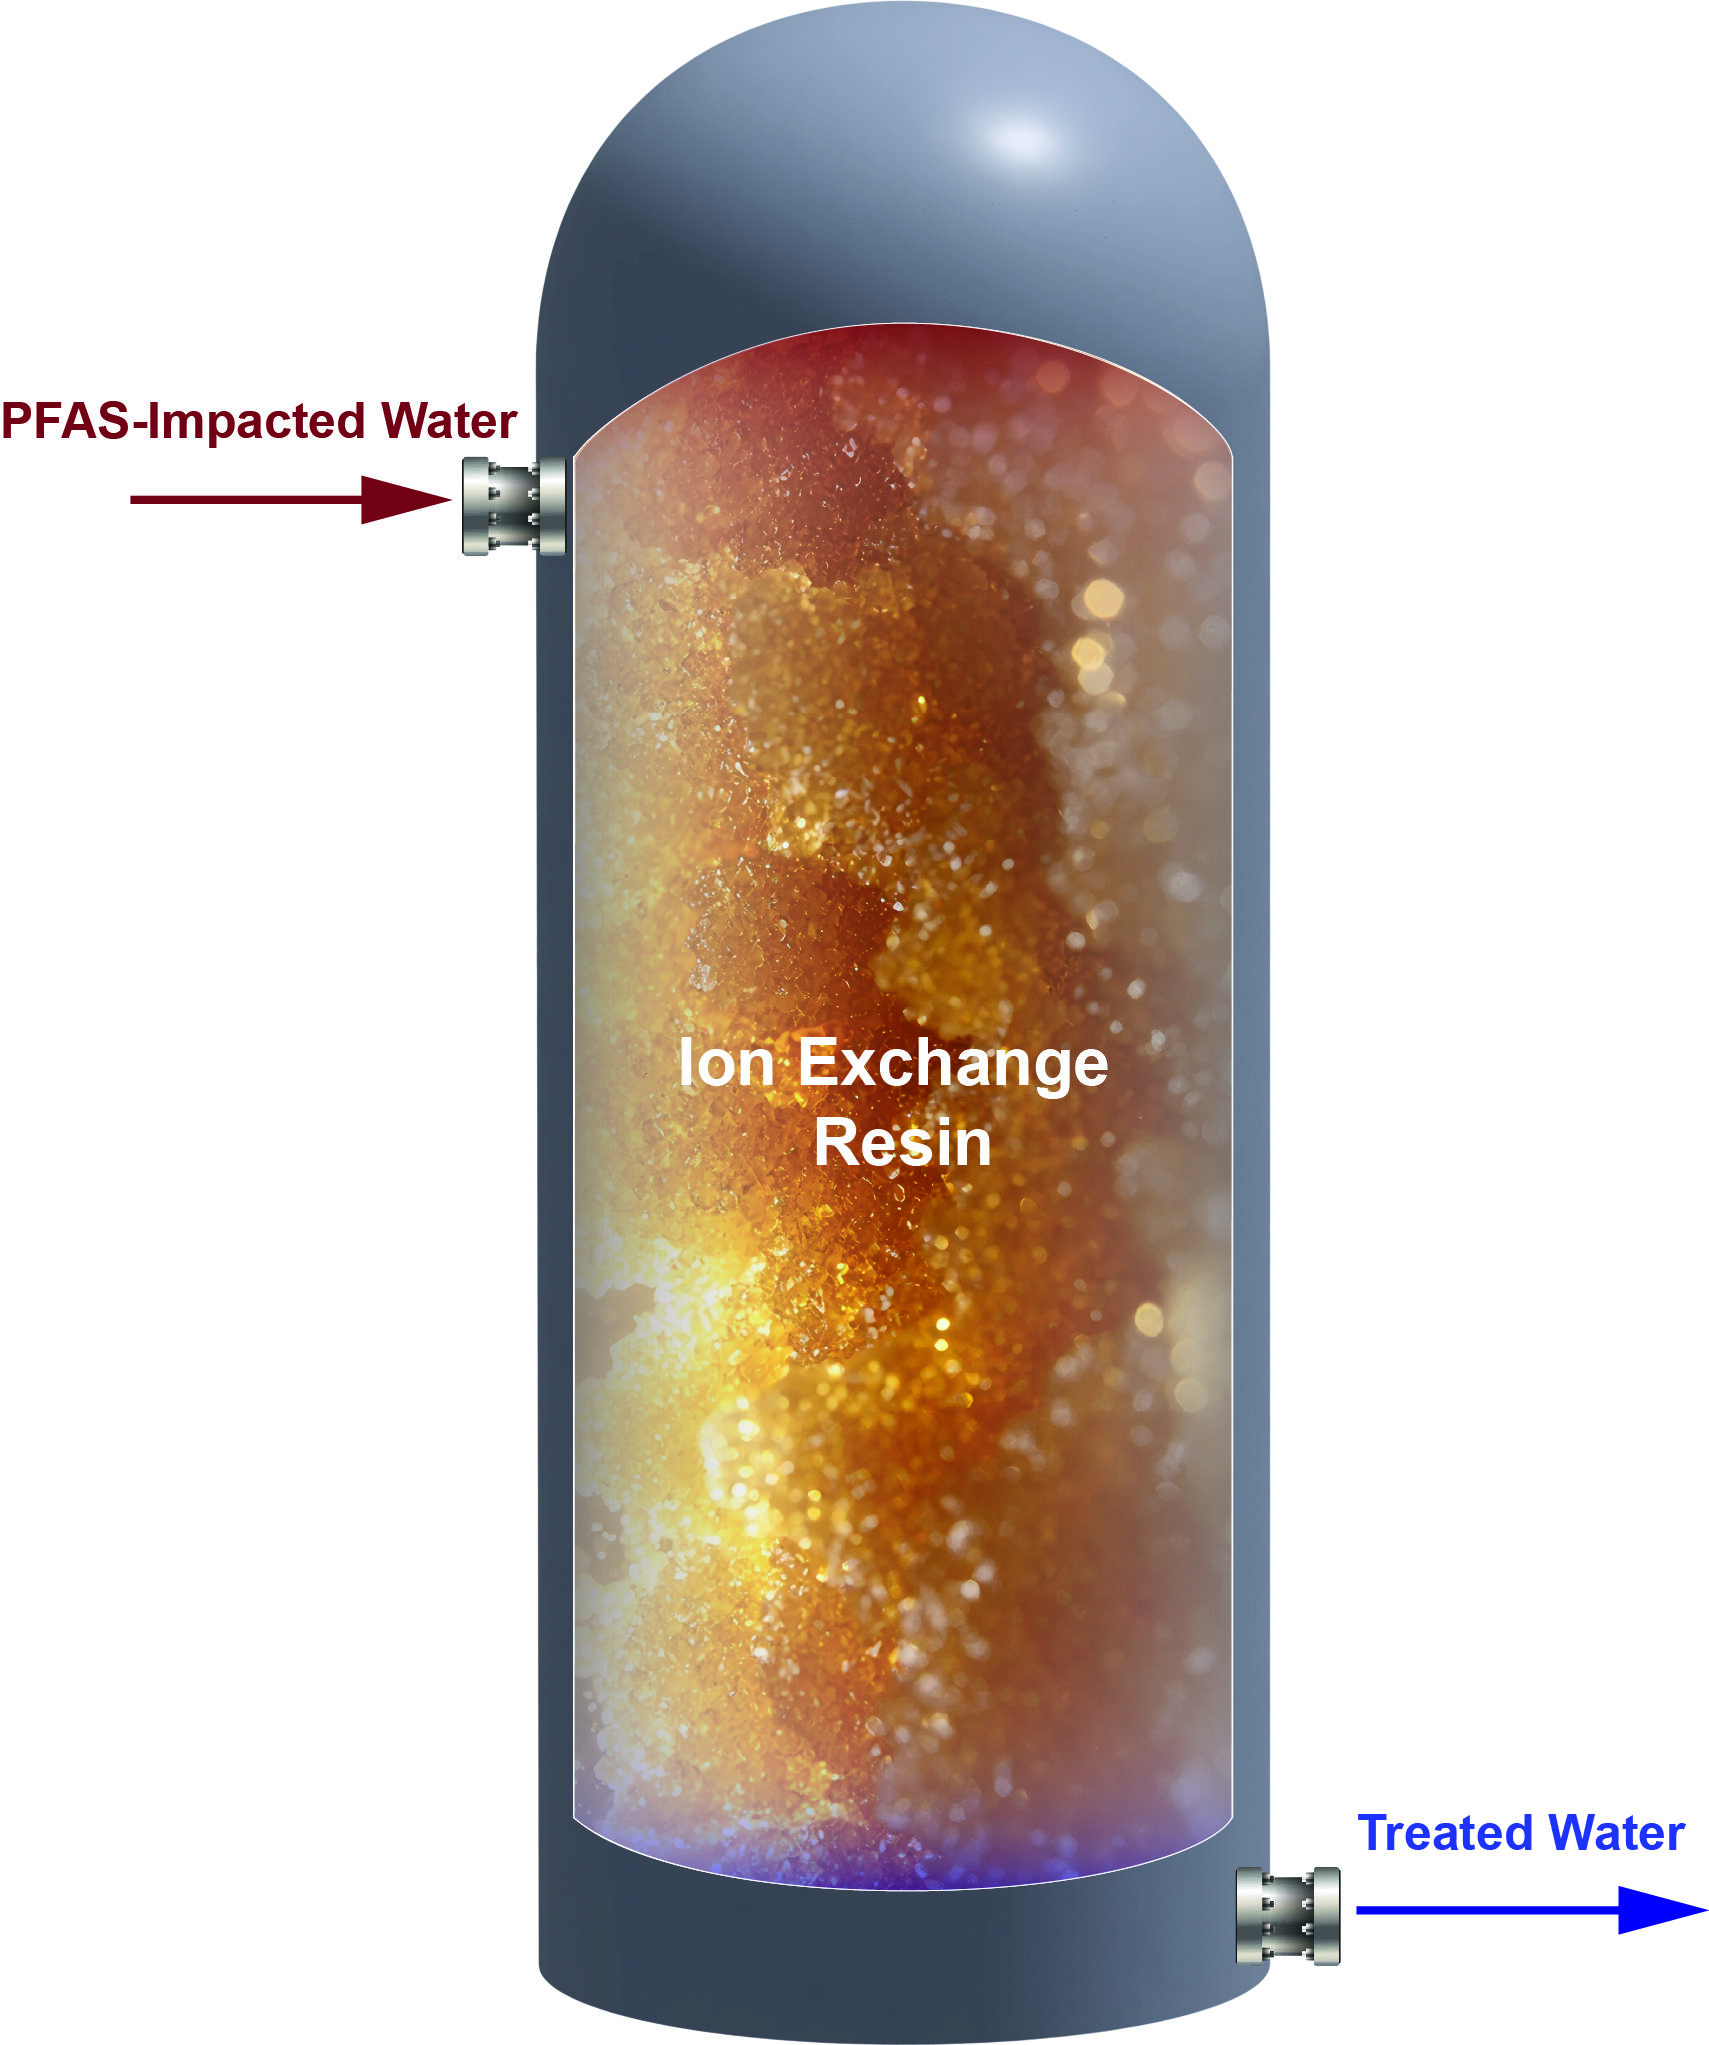
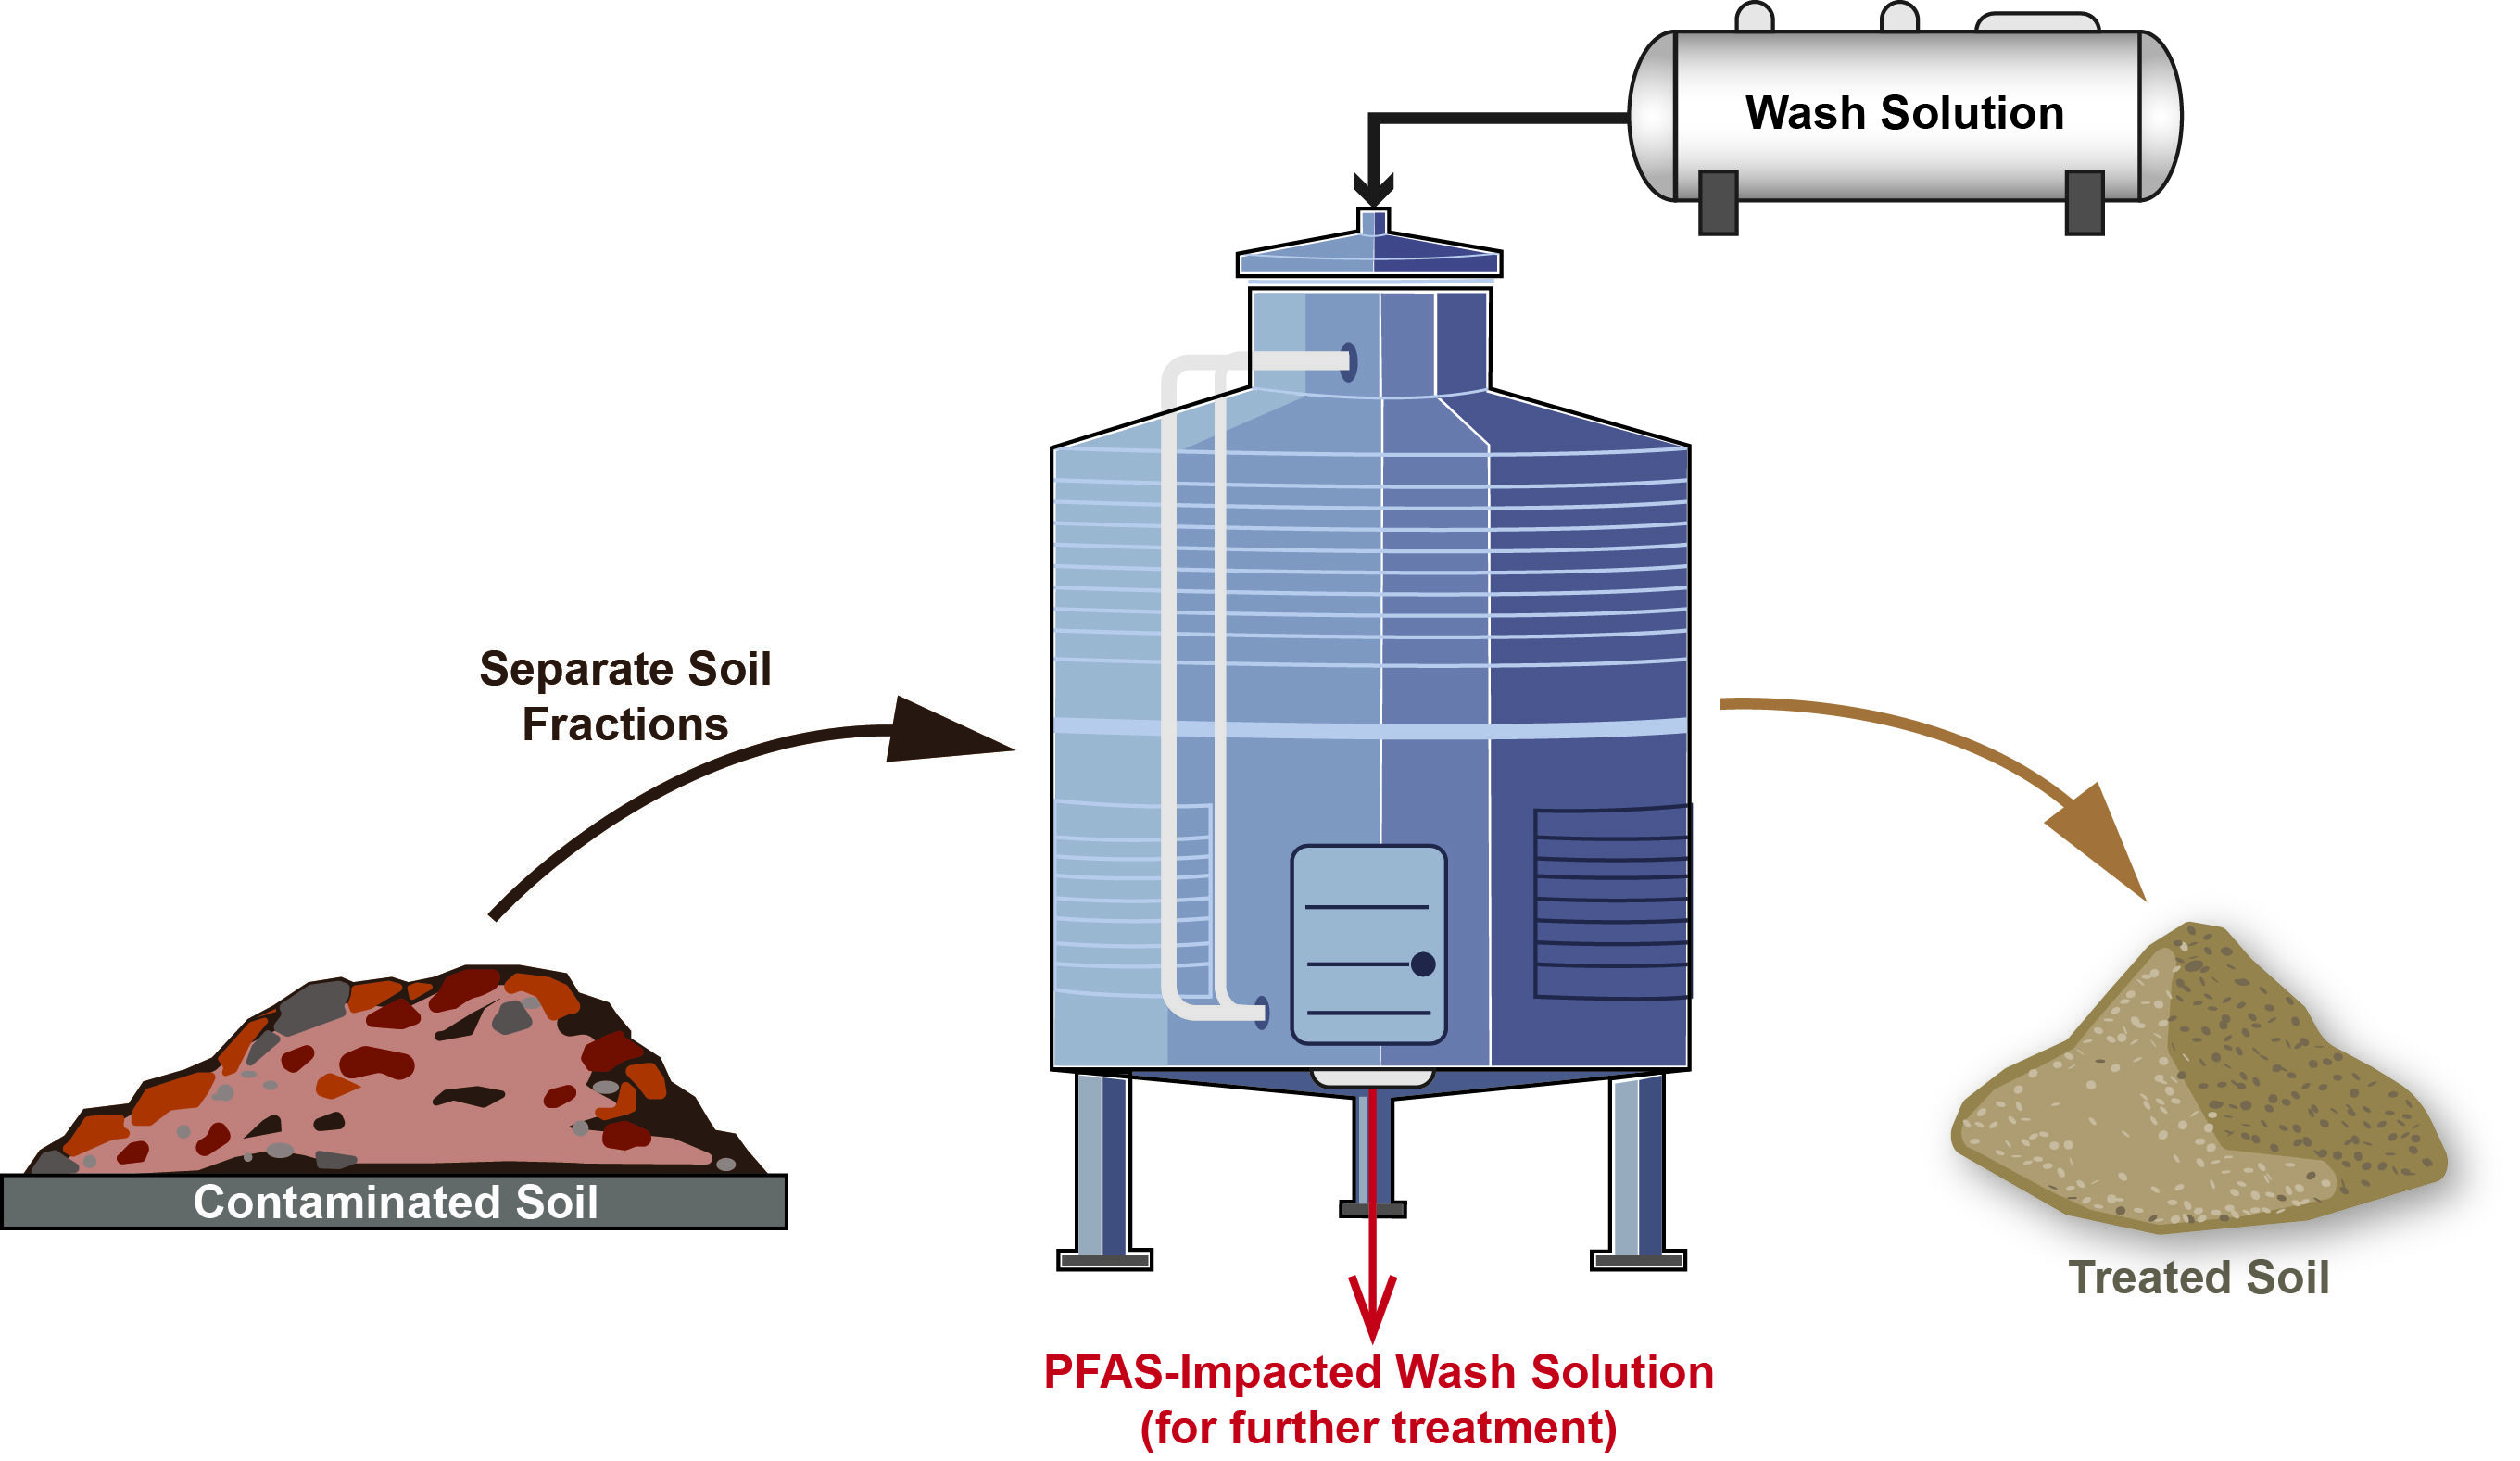
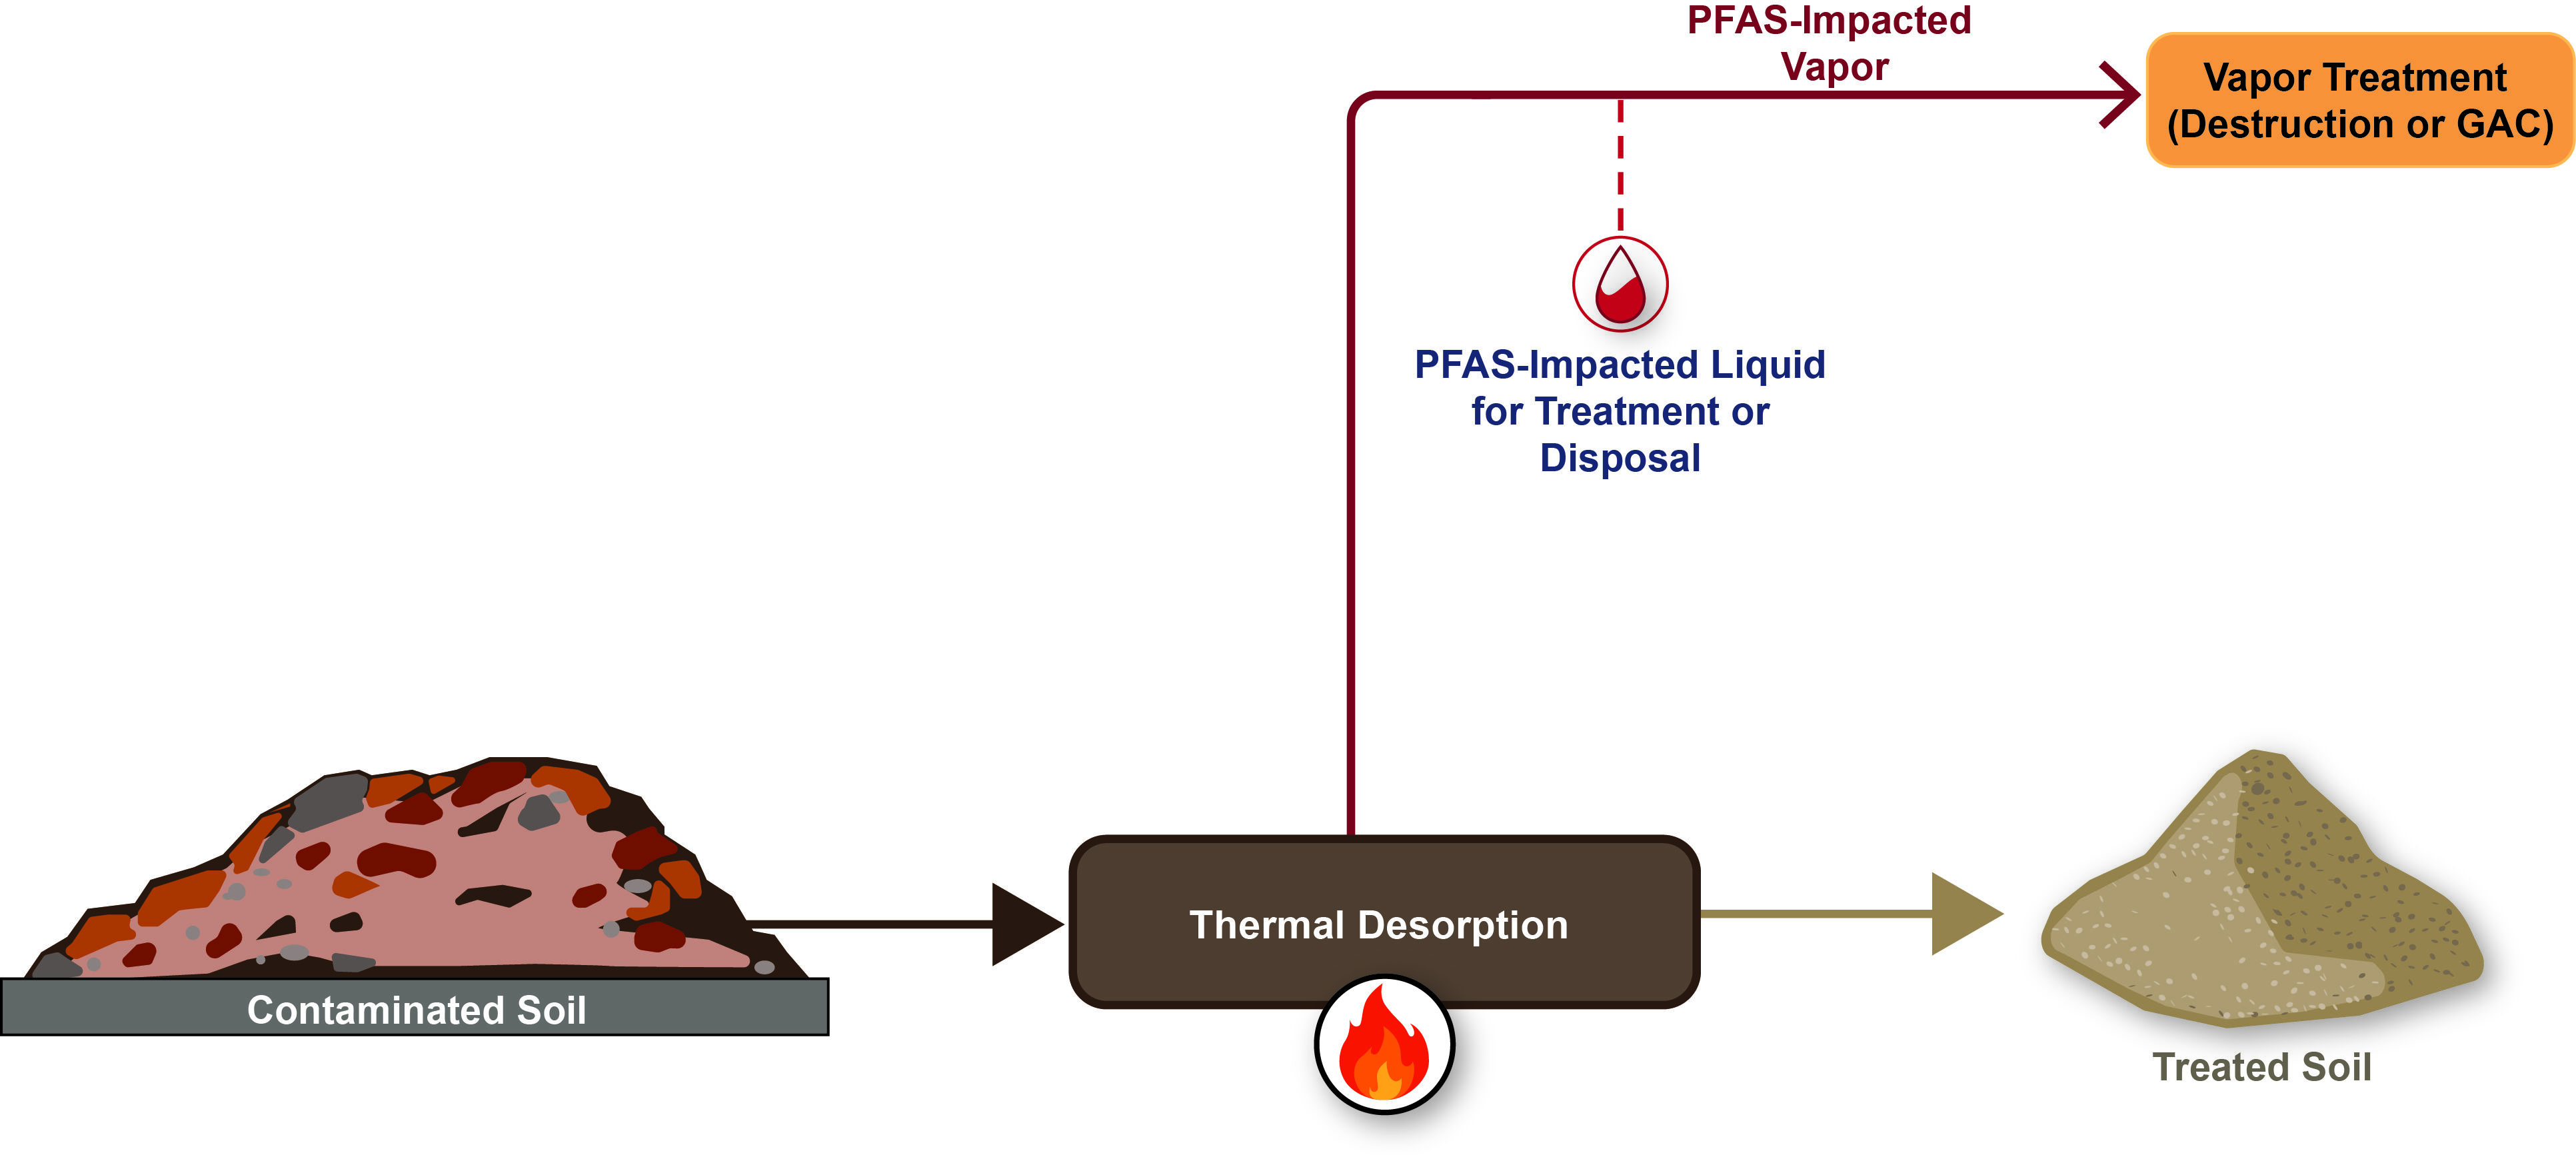
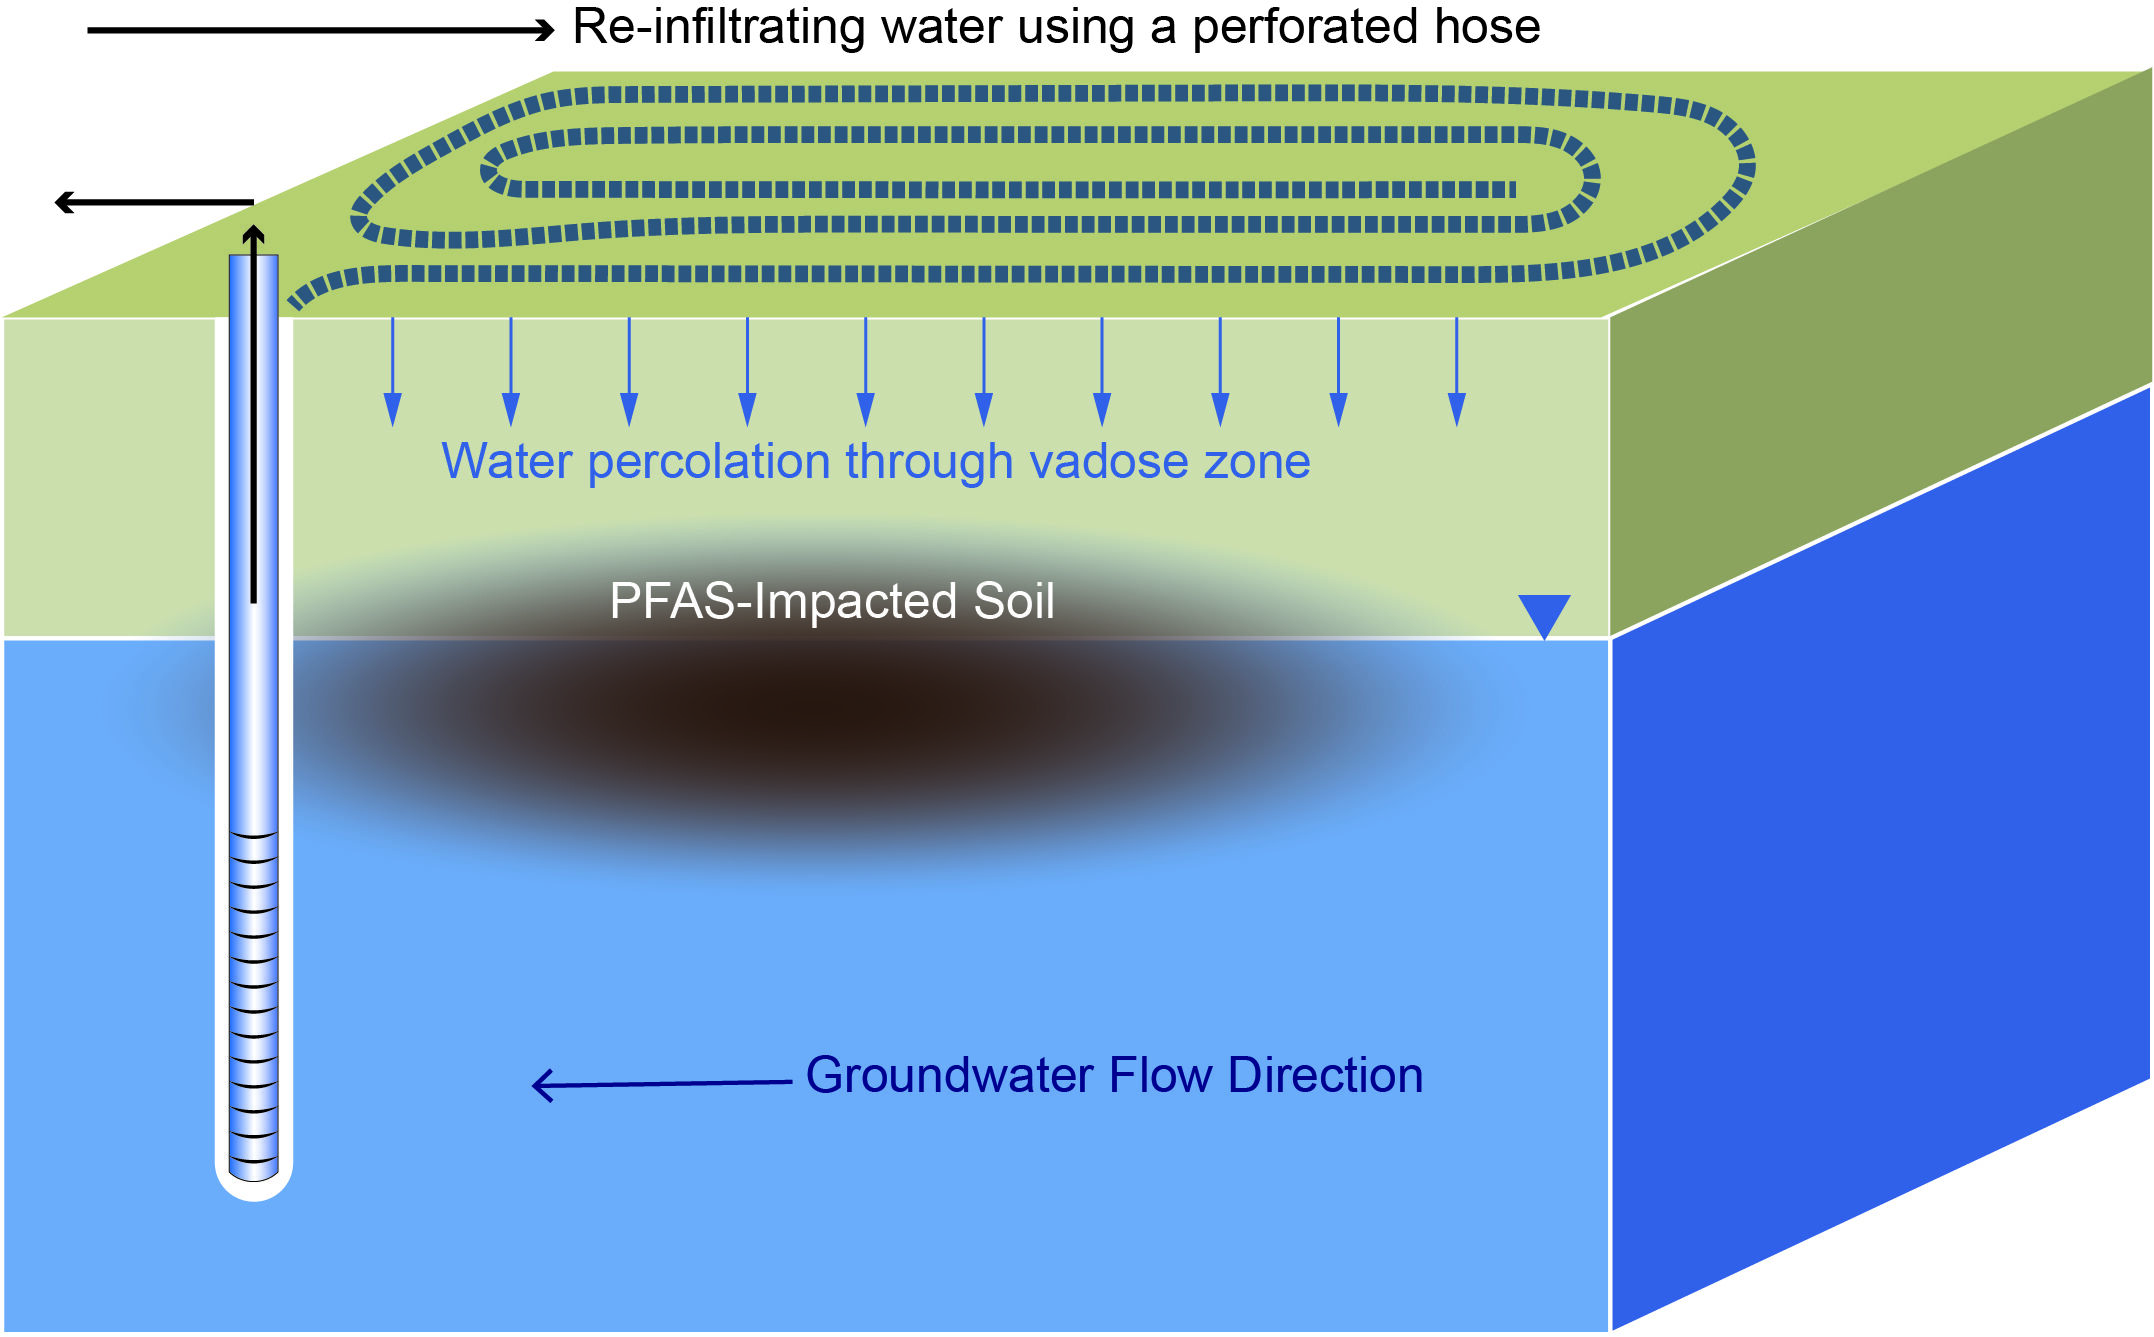
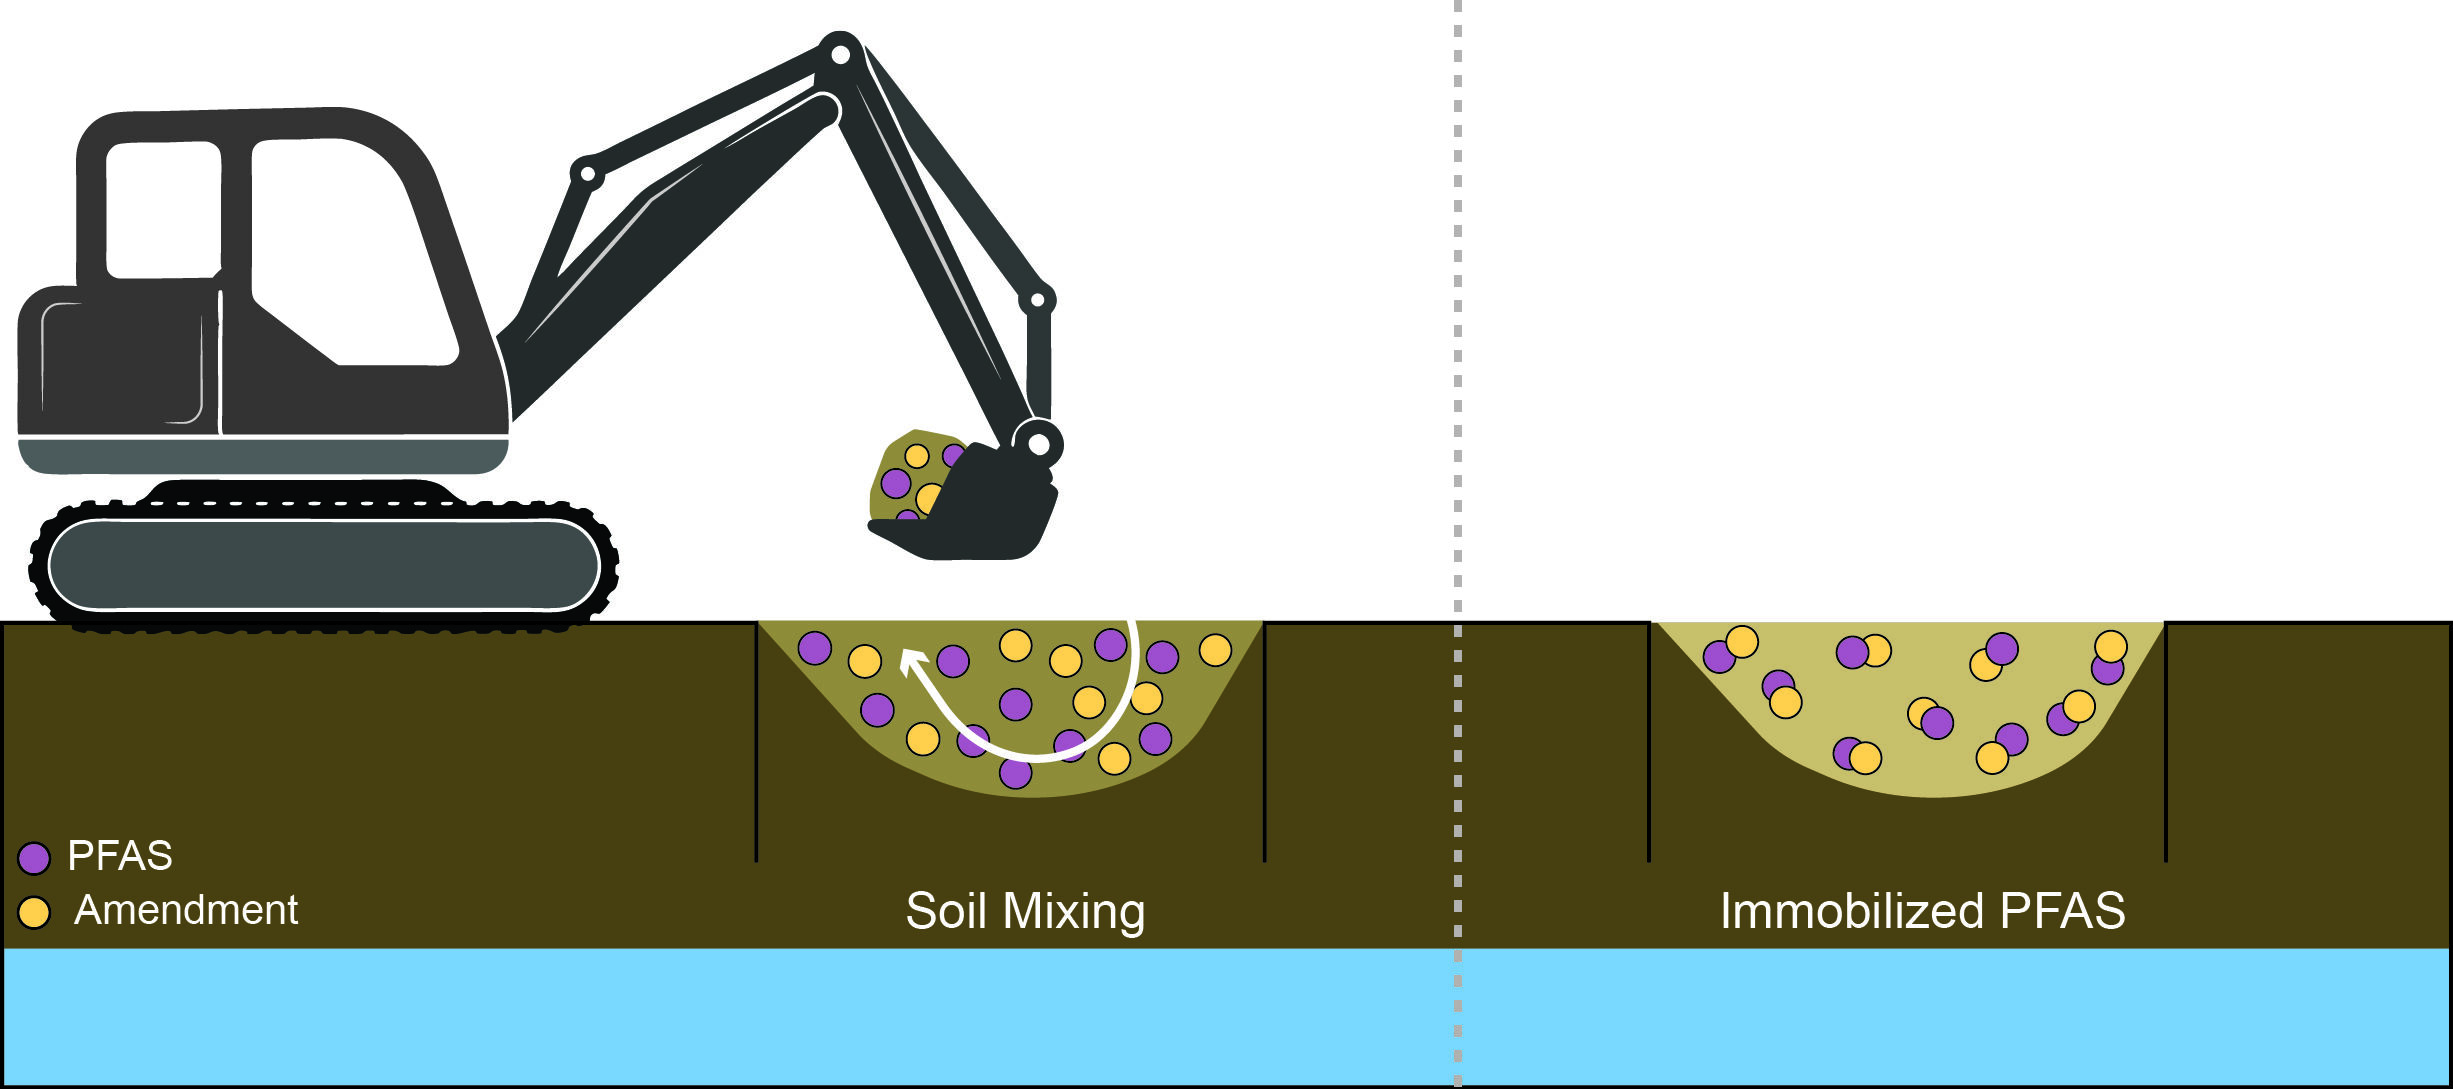
PFAS-ARC focuses on PFAS treatment technologies with Technology Readiness Levels (TRLs) of 6 or greater. The technologies are grouped into three primary process categories: separation, sorption, and destruction, and include the following:
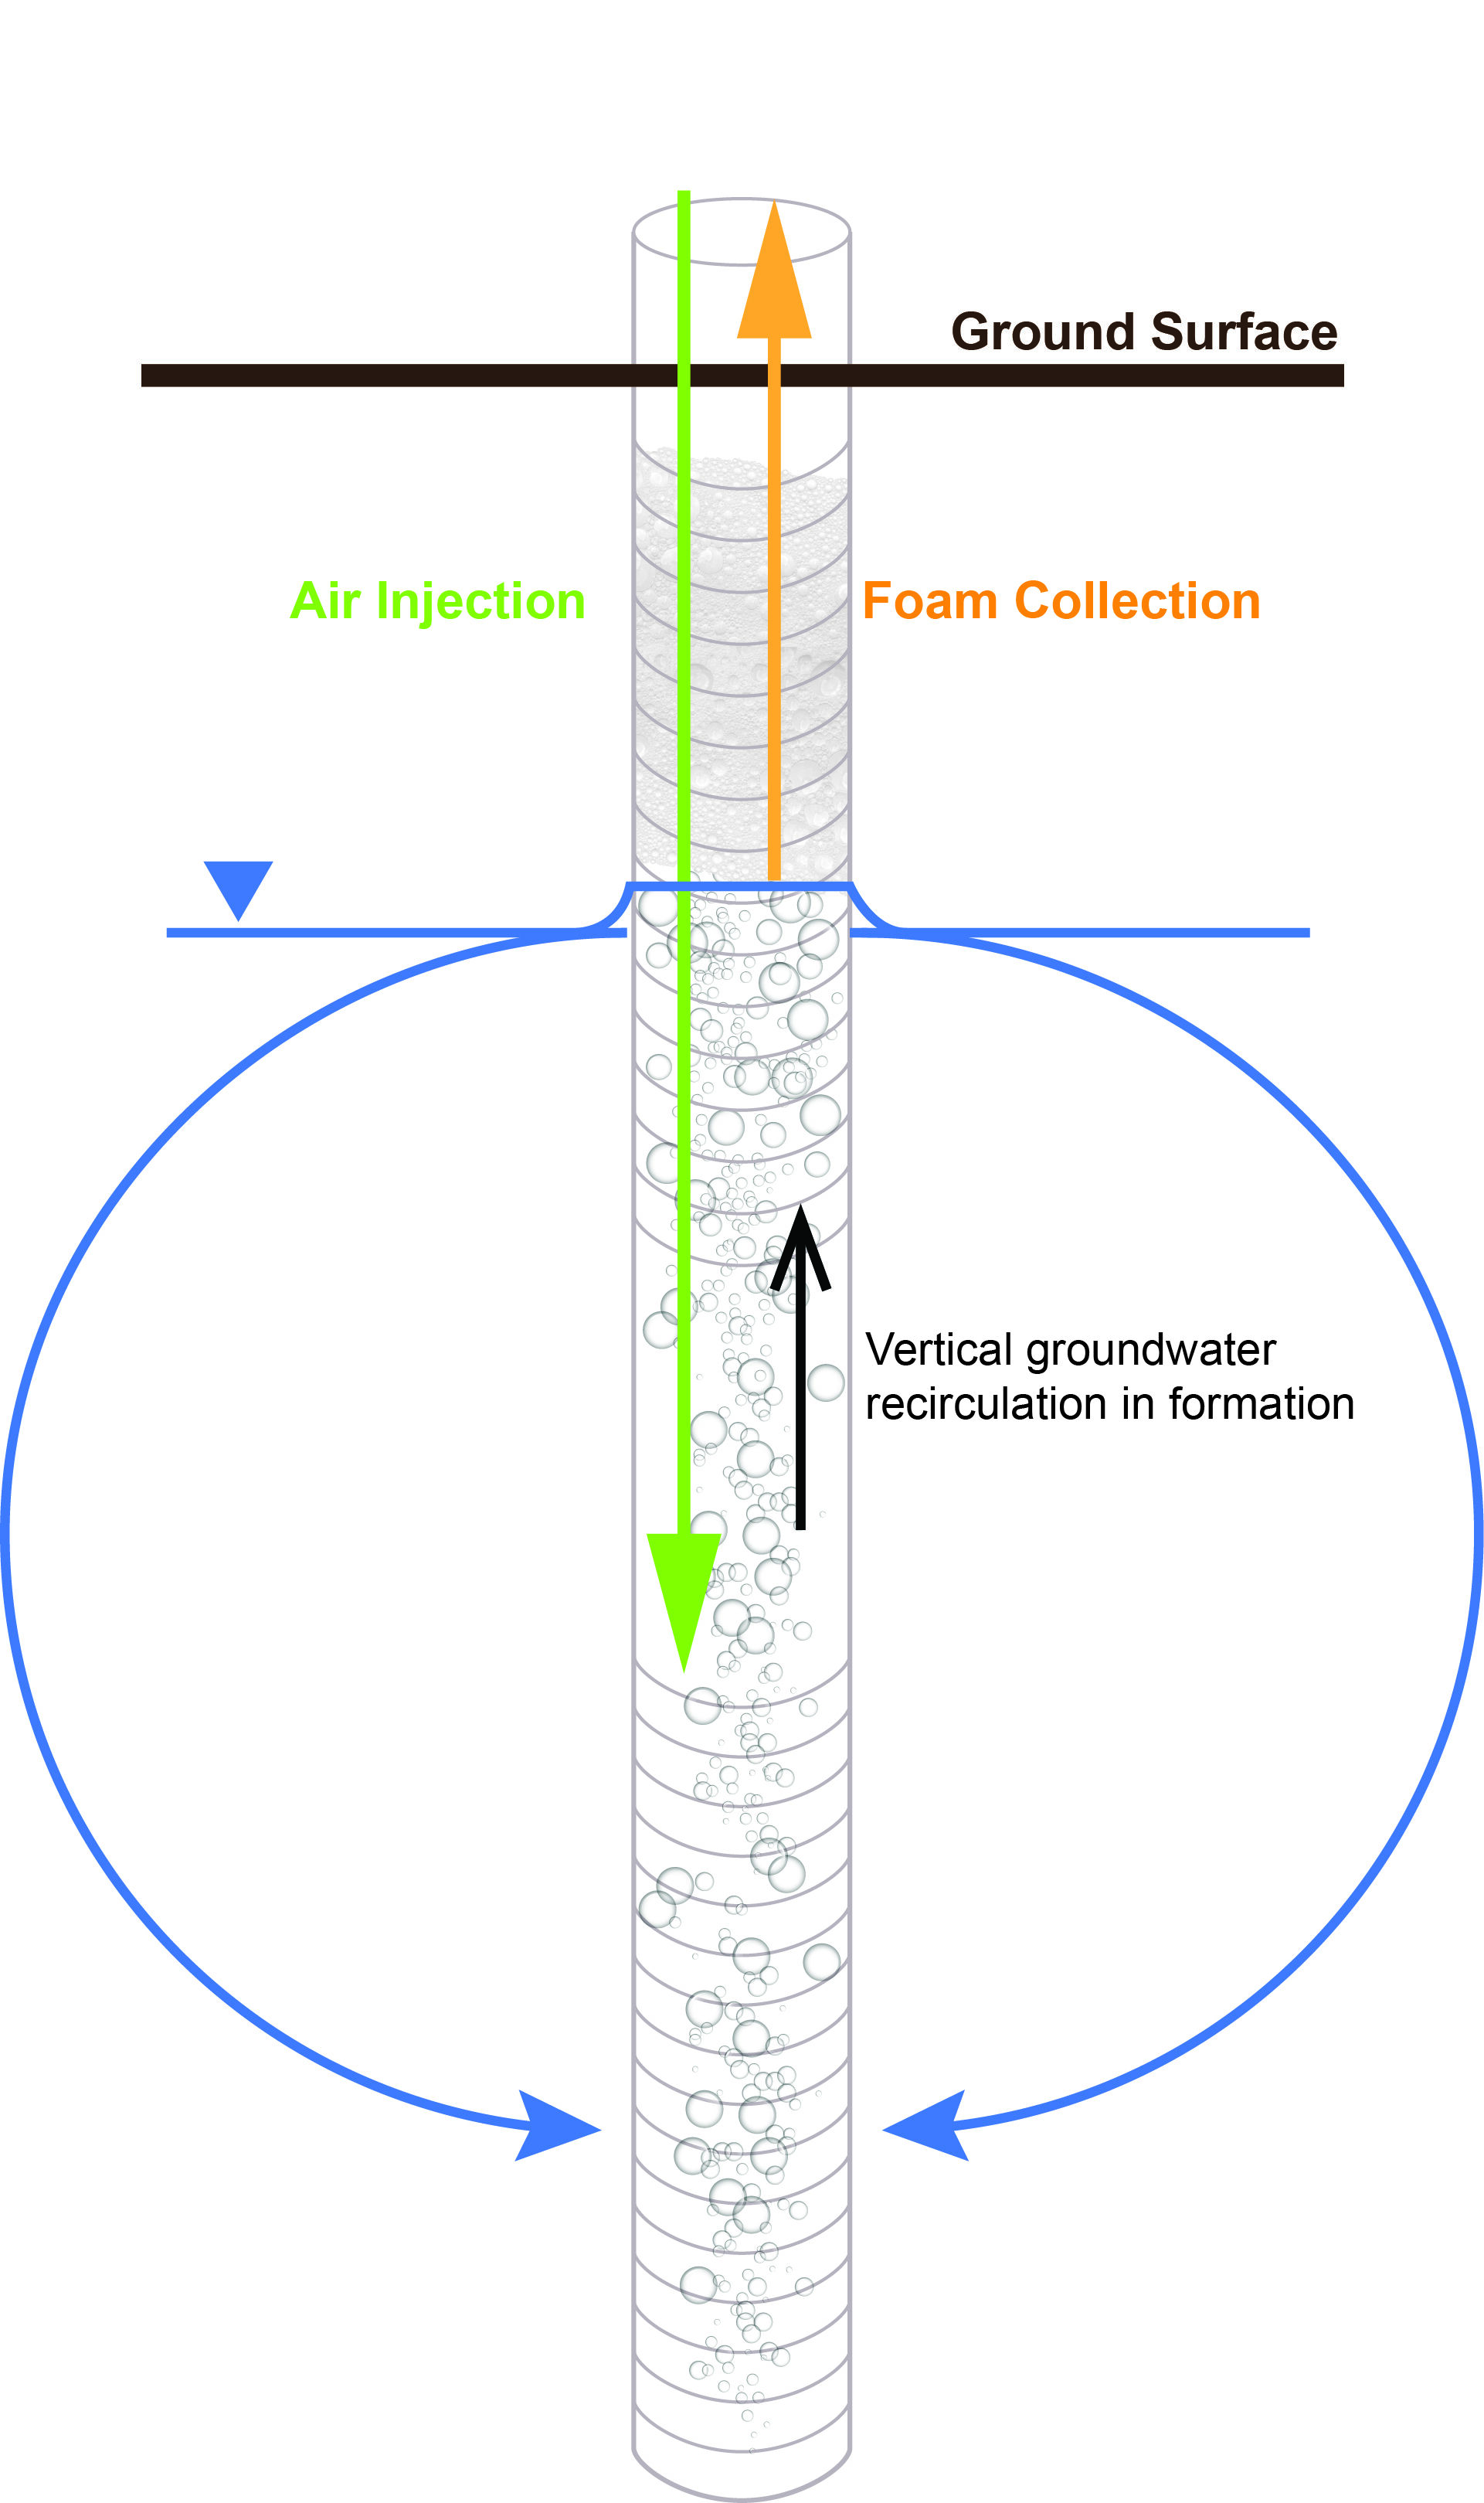
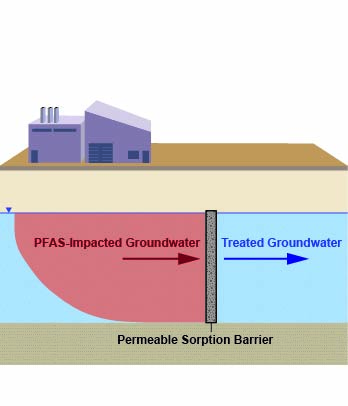
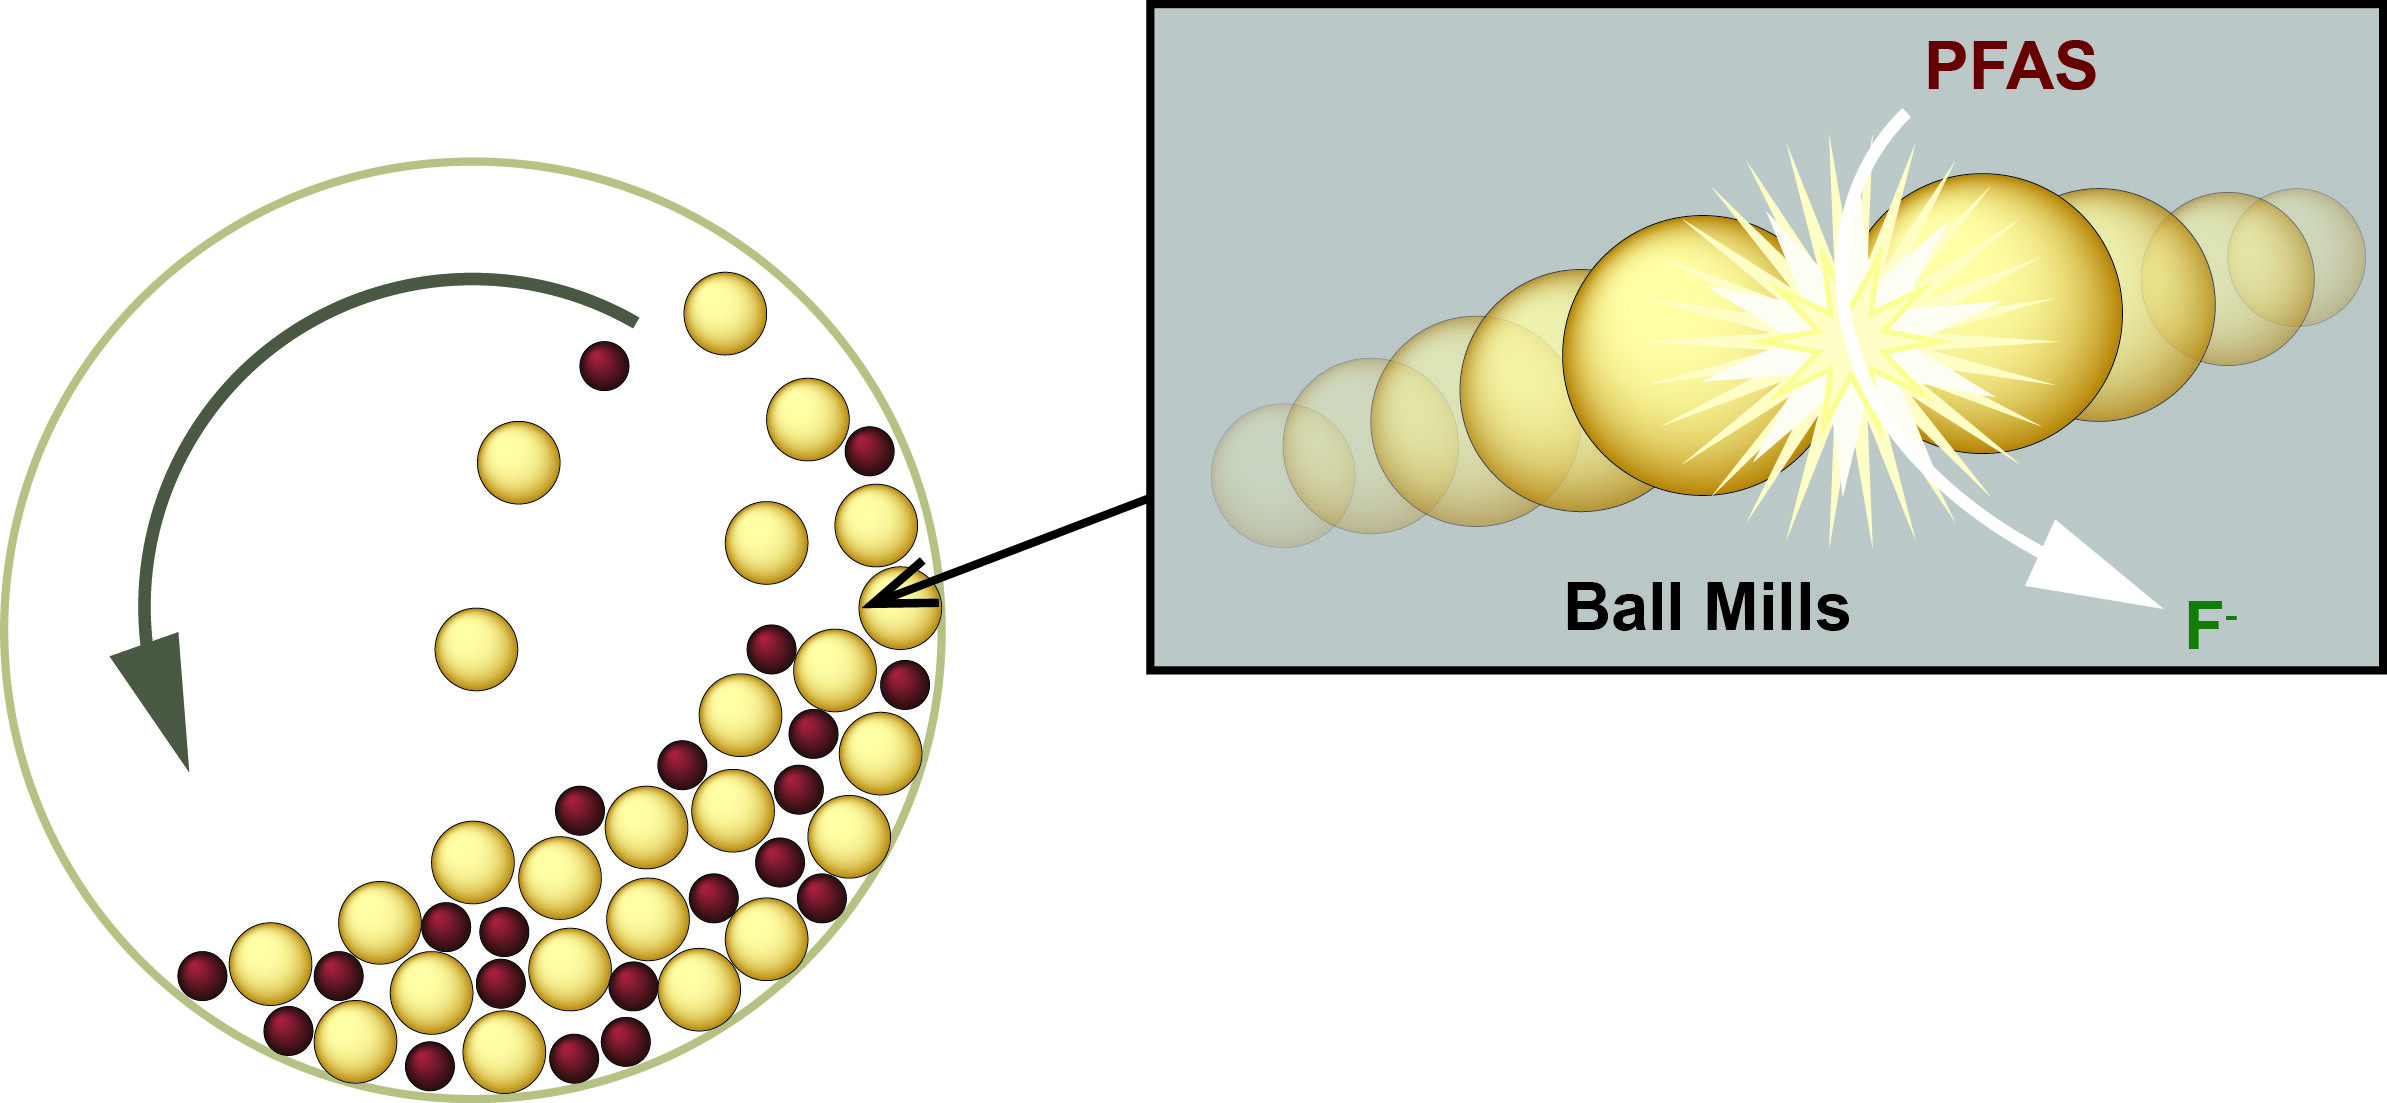
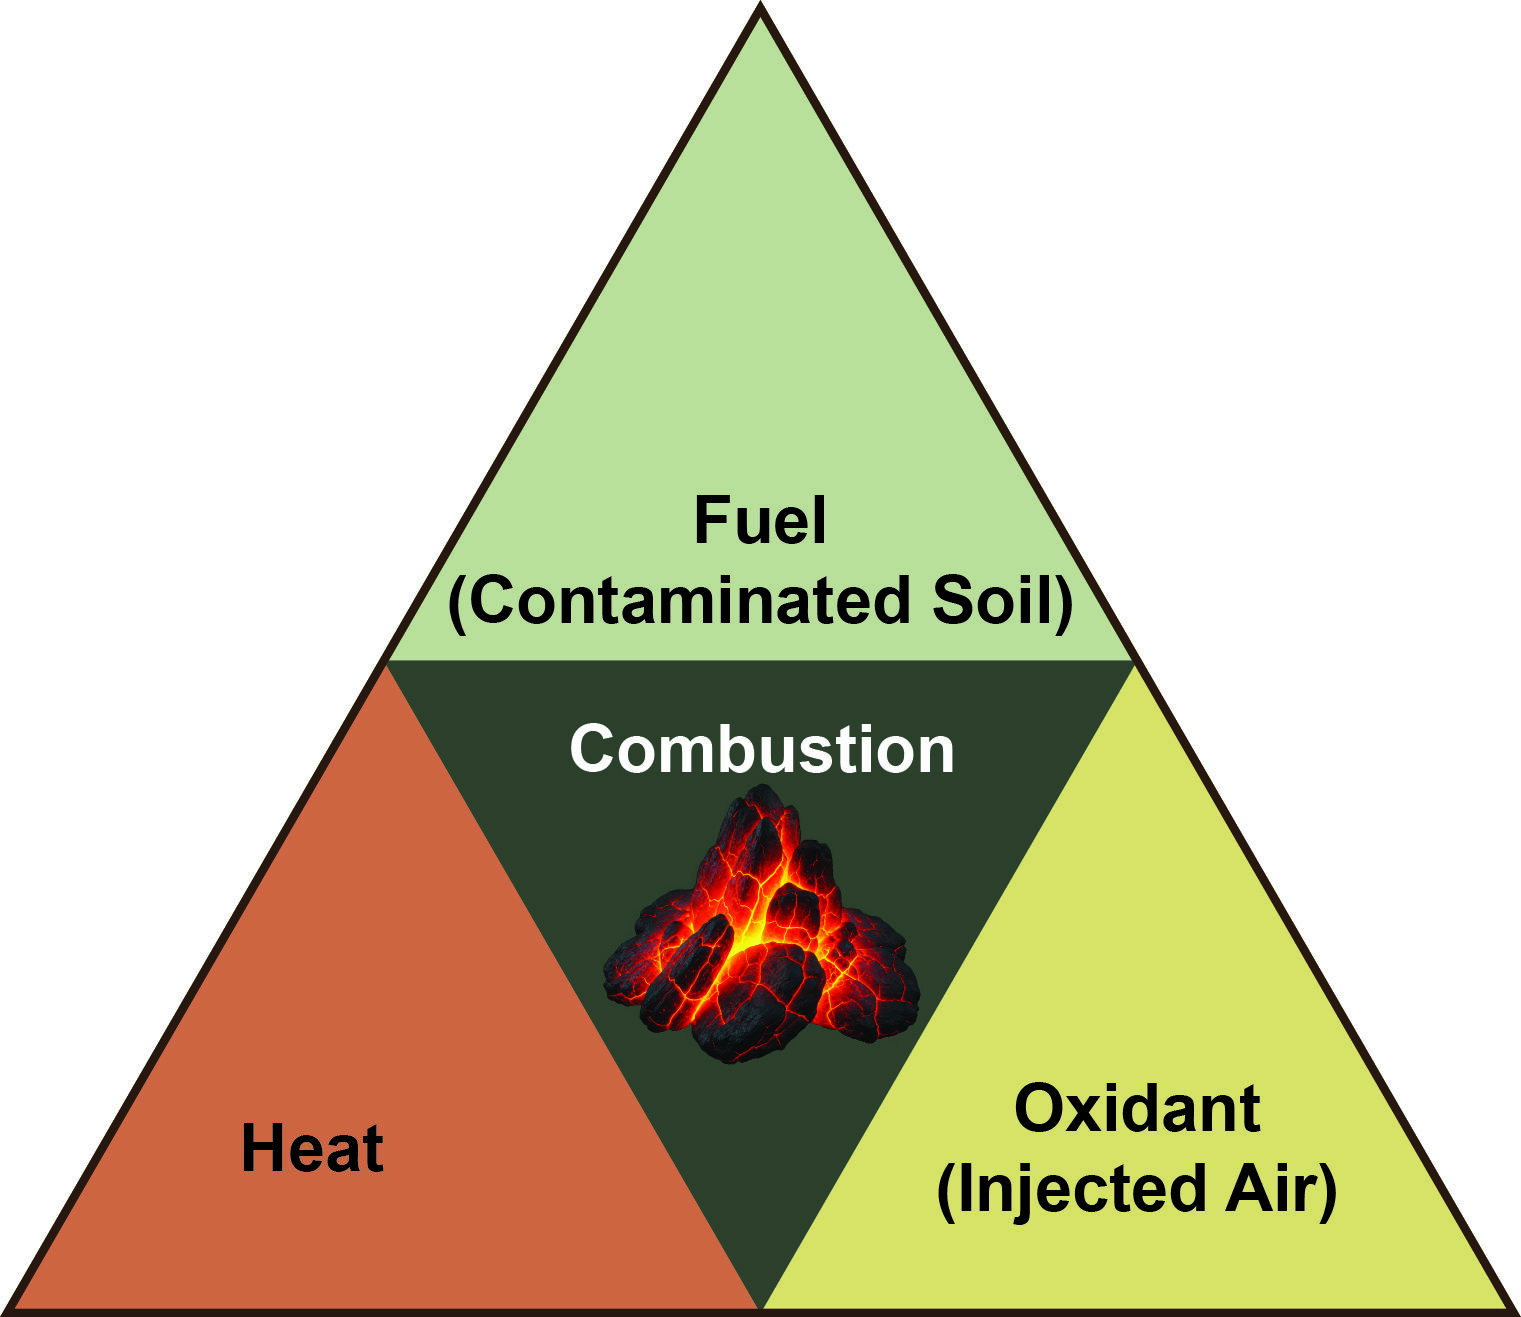
What Studies and Data Sources are Incorporated in Performance Evaluation?
- Published literature or ESTCP PFAS treatment projects
- Target PFAS concentration data available and analytical method identified
- Relevant media treated (groundwater, AFFF, soil, spent media, concentrate)
- Preference for field studies
Evaluating PFAS Treatment Technologies
The PFAS-ARC tool is designed to report quantitative data for a primary category of PFAS remediation performance metrics: concentration reduction. This includes comparisons of pre- and post-treatment concentrations, percent removal, and order-of-magnitude (OoM) reductions. In addition, the tool captures supporting information for each study, such as residence time, treatment capacity, breakthrough behavior, analytical methods, and select water quality parameters.
When evaluating PFAS treatment technologies for a specific site, reliance on percent removal alone is insufficient. A comprehensive assessment should consider site-specific conditions, including influent concentrations, co-contaminants, water matrix characteristics, flow rates, regulatory criteria, and geochemical conditions. Technology selection must also account for practical and operational factors such as residuals management, life-cycle costs, scalability, reliability, maintenance requirements, and long-term monitoring considerations.
Although percent removal is a useful initial indicator of treatment performance under controlled conditions, it does not address key factors such as cost, compliance with effluent standards, byproduct formation, mass loading, or overall system sustainability and resilience. Accordingly, a holistic, site-specific evaluation is necessary to determine the feasibility and effectiveness of any PFAS treatment approach.
How to Cite
Kulkarni, P.R., Goodkind, N., Richardson, S.D., Cartwright, A., Ramos, P., Newell, C.J. (2026). PFAS Applied Remediation Clearinghouse (PFAS-ARC). Environmental Security Technology Certification Program (ESTCP) Project ER25-8746.
Funded by:
Environmental Security Technology Certification Program (ESTCP) (ER25-8746)

About:

Powered by: GSI Environmental Inc.
DISCLAIMER:
The PFAS Applied Remediation Clearinghouse is made available on an as-is basis without guarantee or warranty of any kind, express or implied. The United States Government, GSI Environmental Inc., the authors and reviewers accept no liability resulting from the use of PFAS-ARC or its documentation.
Quick Start Guide
What Are the Performance Evaluation Pages?
The Performance Evaluation pages are a data-visualization hub for the PFAS-ARC tool. They allow users to explore quantitative PFAS treatment performance data from peer-reviewed studies and ESTCP demonstrations across a wide range of technologies and environmental media. Two key pages are available:
Individual PFAS
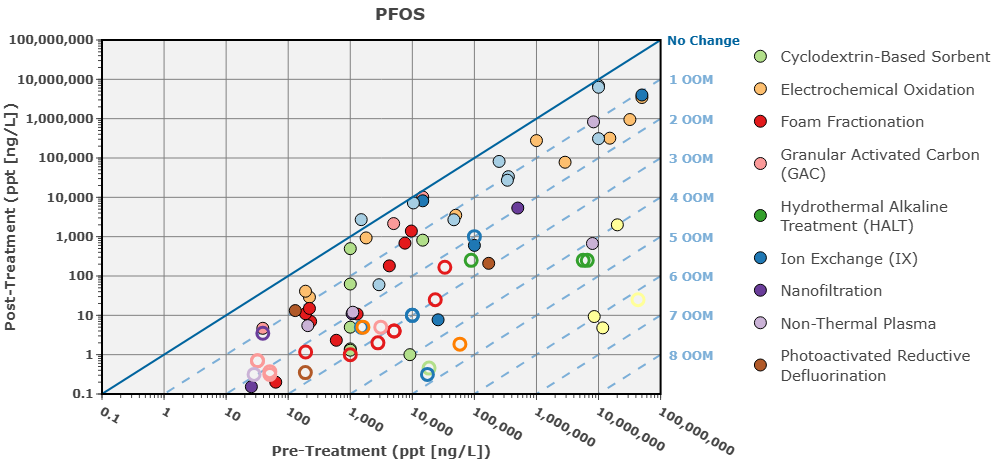
The page is organized around a single PFAS compound at a time (e.g., PFOS, PFOA) and displays all available studies for that compound as interactive data points on a Triangle Chart. Below the chart, a detailed table lists study-level performance metrics and conditions.
Go to Individual PFAS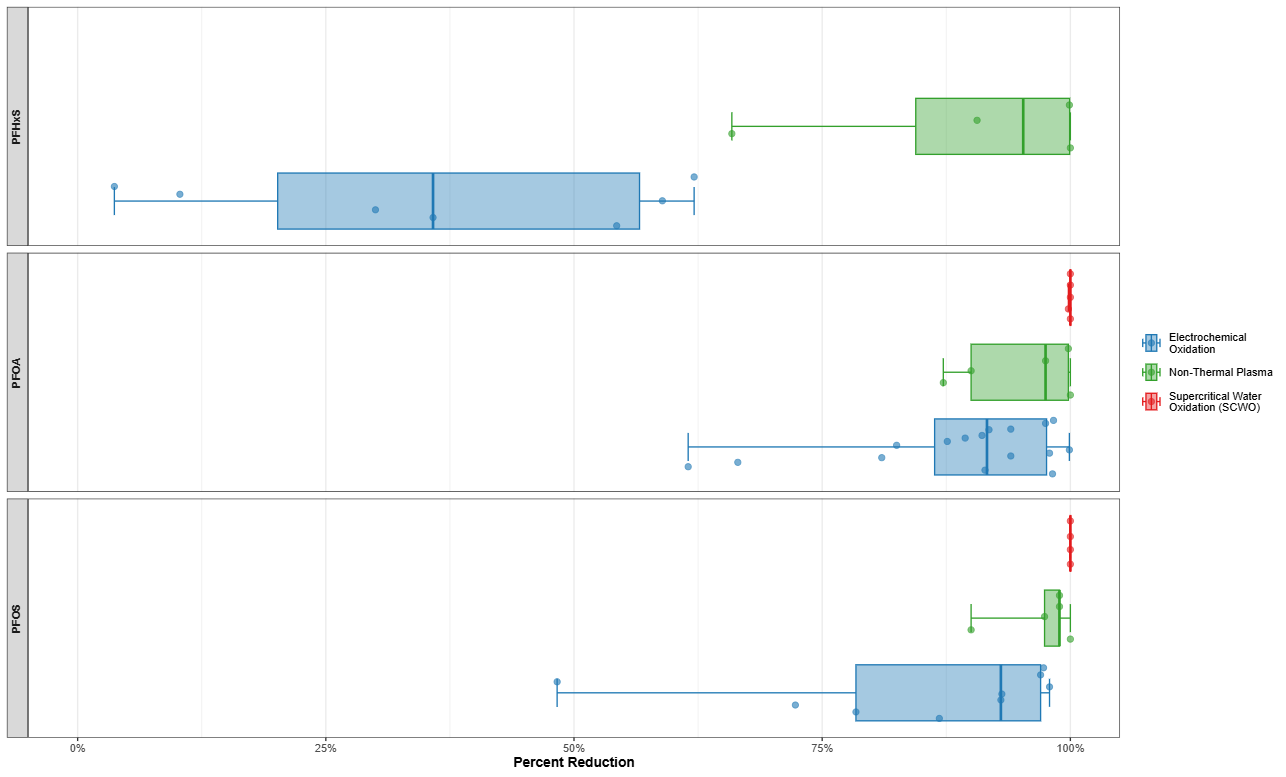
Summary Statistics
This page includes box plots of selected technologies and PFAS, as well as individual dots representing the underlying data points from different studies, sites, and/or media treated.
Go to Summary StatisticsPerformance Evaluation: Individual PFAS
How to Access
On the top navigation panel, click Performance Evaluation; drop-down menu → “Individual PFAS”

The Triangle Chart: How to Read It
The Triangle Chart is a visualization that includes a log-log scatter plot comparing pre- and post-treatment PFAS concentrations from each study (Figure 1).
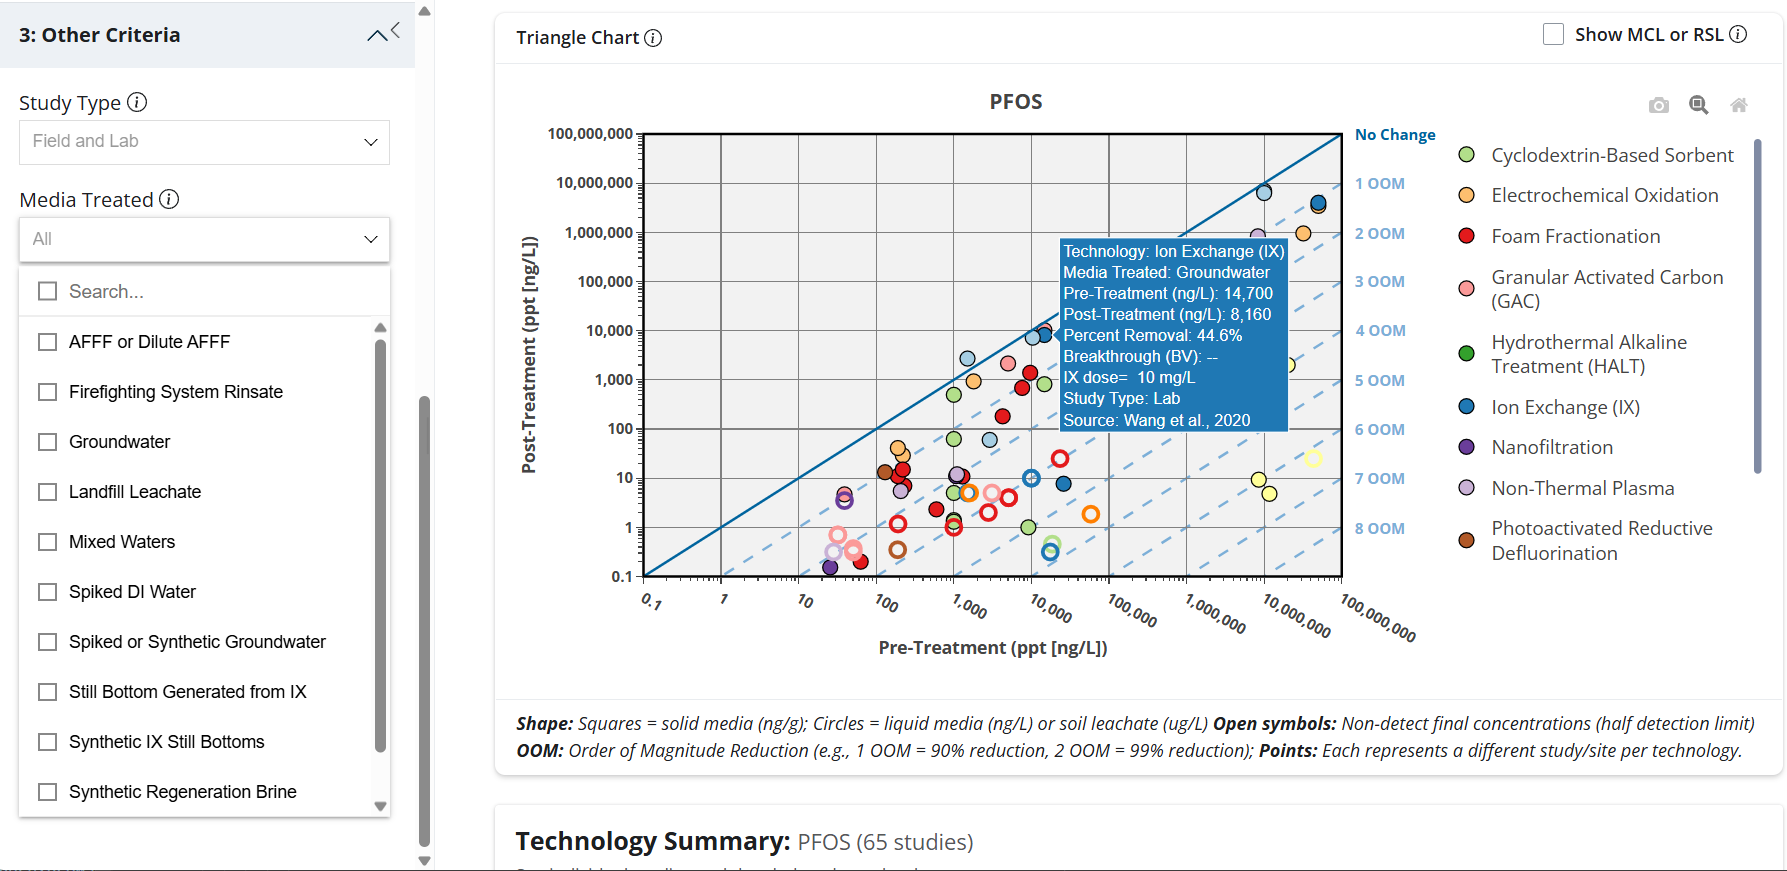
Axes
- X-axis (horizontal): Pre-treatment concentration (log scale)
- Y-axis (vertical): Post-treatment concentration (log scale)
The Diagonal Reference Lines
The solid diagonal line represents No Change — a point on this line means the technology had zero reduction in concentration. Dashed lines below and to the right of the diagonal represent orders-of-magnitude (OOM) reductions:
| Order of Magnitude (OOM) | Approx. % Removal | Chart Location |
|---|---|---|
| No Change | 0% | Points on the diagonal line |
| 1 OOM | ~90% | Points 1 band below the diagonal |
| 2 OOM | ~99% | Points 2 bands below the diagonal |
| 3 OOM | ~99.9% | Points 3 bands below the diagonal |
| 4+ OOM | >99.99% | Points far below the diagonal |
Show Maximum Contaminant Level (MCL) or Regional Screening Level (RSL)
A Show MCL or RSL checkbox in the upper-right corner of the Triangle Chart overlays the applicable regulatory threshold as a red dashed horizontal line. The line is labeled MCL for liquid media and RSL for solid media, drawn at the post-treatment (y-axis) concentration for the selected PFAS. Because it runs along the post-treatment axis, data points below the line indicate a final concentration at or below the threshold. The toggle is off by default; if no threshold value exists for the selected PFAS and media, no line is shown.
Data Point Symbols
- Circles = liquid media (ng/L), such as groundwater, AFFF, or landfill leachate
- Squares = solid media (ng/g), such as soil or spent treatment media
- Open/hollow symbols = non-detect final concentrations (plotted at half the detection limit)
- Color = technology (see legend on the right side of the chart)
Each point represents a unique study/site per technology
Additional Notes:
- Hovering over a data point displays key study details, including technology, media treated, pre- and post-treatment concentrations, study type (field or lab), and source.
- On the chart itself, you can also use the magnifying glass to zoom into a region, the reset icon to zoom back out, the expand icon for full screen, and the download icon to export the chart image.
- Liquid treatment technologies above the MCL can be polished with granular activated carbon (GAC) to meet regulatory requirements.
- Regulatory thresholds may change. An information icon (i) is included to indicate the source/reference for the current MCL/RSL values.
Individual data points on the Triangle Chart can be clicked, and the respective study will be highlighted in the Individual Study Data section. Here, clicking a row reveals the full source citation, and scrolling to the right reveals additional metrics and study conditions (see the Individual Study Data section). A "Selected:" chip also appears above the Triangle Chart showing the source of the selected study, with buttons to jump to its row in the table or clear the selection.
Selection Criteria: Filtering the Data
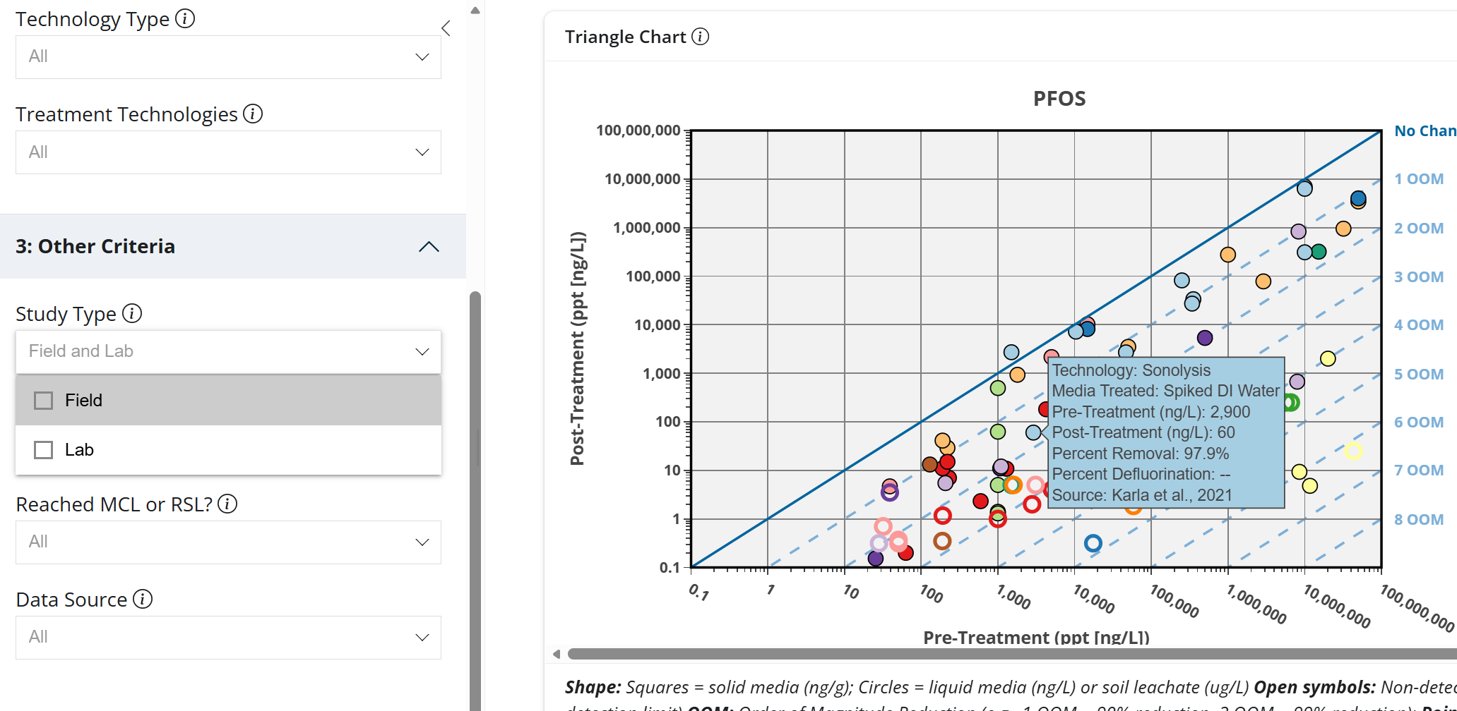
The left-hand panel contains filters (Selection Criteria) that allow users to narrow the data shown on the Triangle Chart to match their specific site conditions or technology of interest (Figure 2). Filters operate simultaneously — applying multiple filters further narrows the visible data points.
Available Filters
- PFAS Selection: The individual PFAS compound (e.g., PFOS, PFOA).
- Where Treatment Occurs: In-Situ or Ex-Situ
- Target Media Type: Liquid or Solid
- Technology Type: Destruction, Separation, or Sorption
- Treatment Technologies: Individual technology (e.g., Ion Exchange, GAC, Sonolysis)
- Study Type: Field study, Lab study, or both
- Media Treated: The specific matrix tested (see list below)
- Reached MCL or RSL?: Filter for studies meeting regulatory thresholds
- Data Source: Filter by published literature or ESTCP project reports
Media Treated Options
- Groundwater (field-collected or spiked/synthetic)
- Aqueous film-forming foam (AFFF) or diluted AFFF
- Treatment concentrate (from concentration technologies)
- Landfill leachate
- Ion exchange (IX) still bottoms or regeneration brine
- Soil (field-collected or spiked/synthetic)
- Spent treatment media (e.g., GAC and IX resins)
As additional studies are incorporated, more media treated may be included.
Technology Summary:
This section presents a comparison table showing how well individual technologies perform, based on studies informed by the user selection criteria shown on the Triangle Chart. Key columns include:
- Technology: The treatment technology selected.
- Data Points: How many individual studies/data values were used for that technology and selected PFAS
- Pre/Post-Treatment Concentration Ranges: The lowest-to-highest concentrations measured before and after treatment.
- Percent Reduction Range: The spread between the lowest and highest reduction performance seen across studies.
- Median Percent Reduction: A typical, middle-of-the-pack performance value (shown as "--" when there’s not enough data to calculate it).
Additional Notes:
- Summary tables and data are shown for the studies per the user-selected criteria and may include a mix of media treated, treatment conditions, and treatment scales.
Individual Study Data:
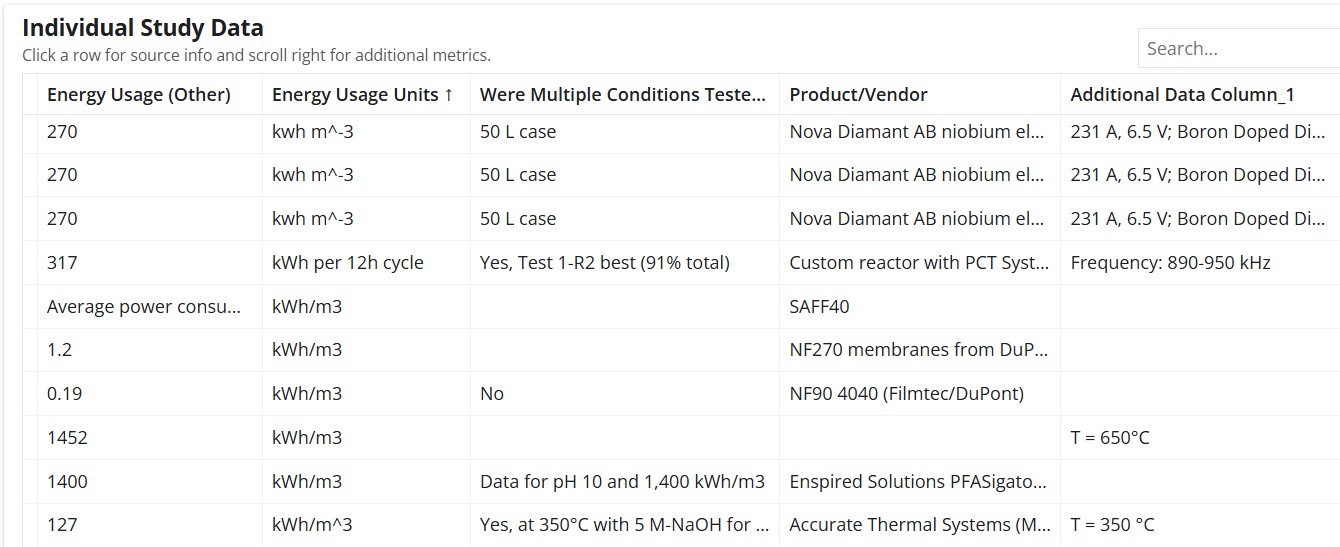
Below the Triangle Chart, a scrollable data table provides granular performance metrics for every study included in the selected filters (Figure 3). Clicking a row reveals the full source citation. Scrolling right reveals additional metrics and study conditions.
Data Collected and Shown Per Study
For each study, the following are shown:
- Quantitative Metrics: Include pre- and post- concentrations, percent removal, order-of-magnitude (OOM) reduction.
- Metrics and Study Conditions: Individual data points/studies also include additional metrics, where applicable, such as selected conditions of treatment (best-performing per study), analytical method, and study type (field or lab-conducted study).
The table below lists metrics, with information shown per study where data were available/applicable.
- Pre-treatment concentration (ng/L or ng/g)
- Post-treatment concentration (ng/L or ng/g)
- Percent Reduction (%)
- Technology Type
- Technology
- Field/Lab Study
- Media Treated
- PFAS Analytical Method
- Influent Total Organic Carbon (TOC)
- Specific Conductivity
- Residence Time (min)
- Tech Volume Capacity
- Volume Treated
- Breakthrough (Bed Volumes)
- Percent Defluorination
- Fluorine Mass Balance
- Electrical Energy per Order (EE/O)
- Energy Usage (Other)
- Were Multiple Conditions Tested?
- Product/Vendor
- Additional relevant conditions (e.g., dose, EBCT, etc)
- Study Reference
Individual rows reveal the full source citation, which can be clicked to open the ESTCP website link or the journal article page.
Performance Evaluation: Summary Statistics
How to Access
On the top navigation panel, click Performance Evaluation; drop-down menu → “Summary Statistics”
Reading the Box Plots
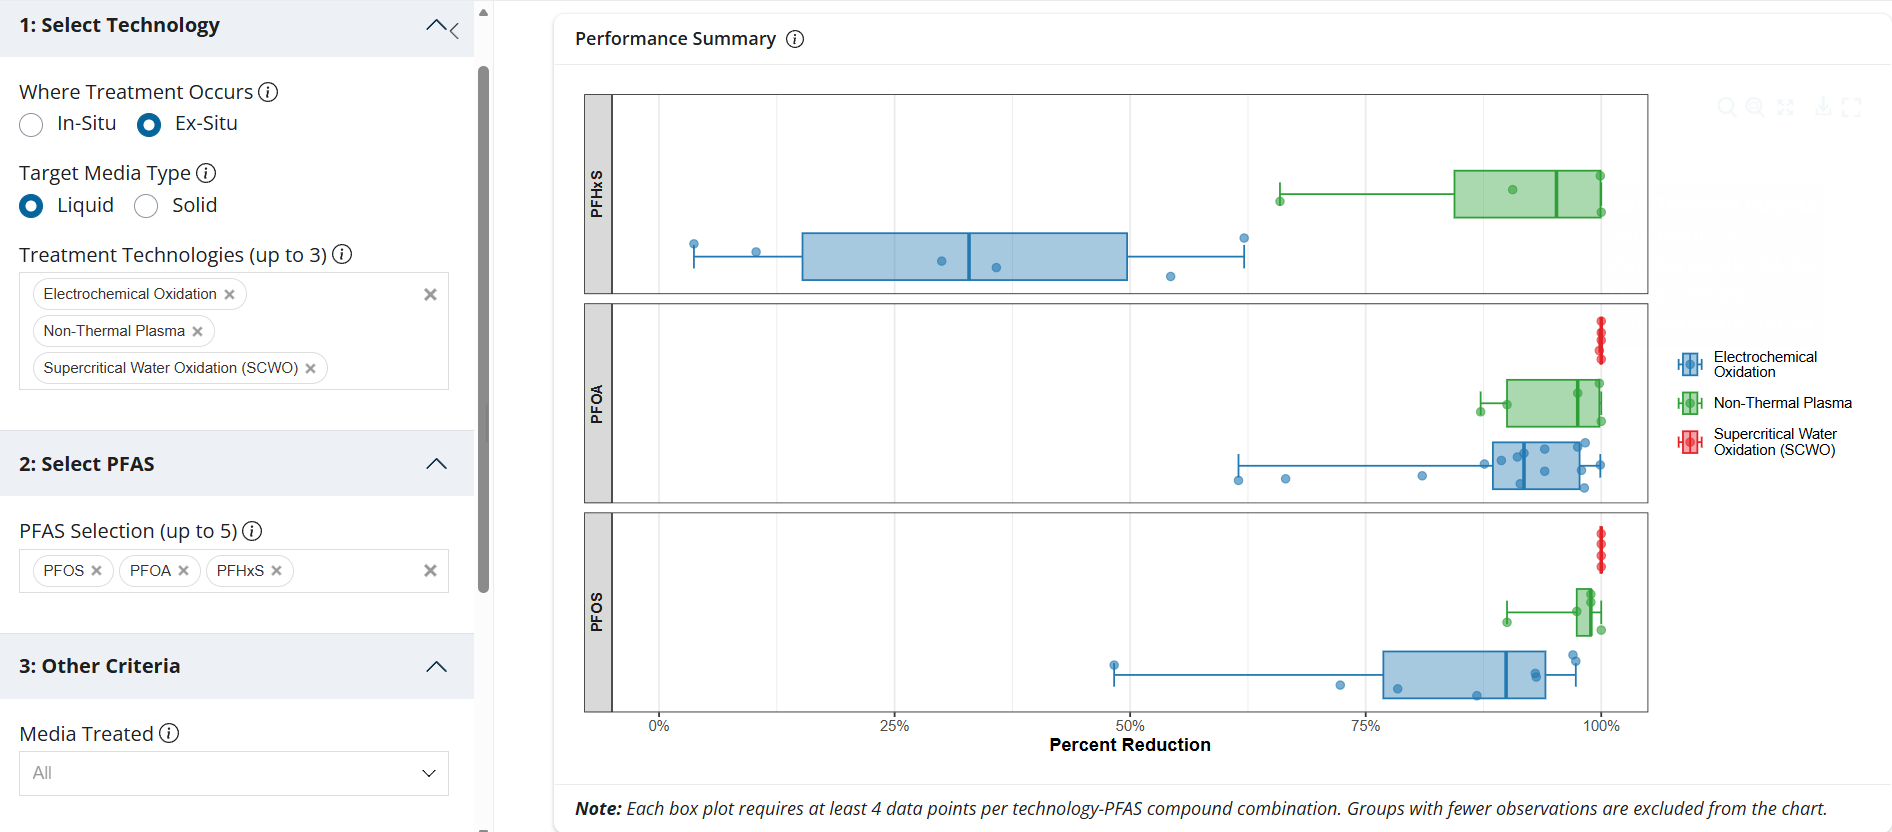
The Performance Summary box plot compares the distribution of Percent Reduction (x-axis) across the selected individual PFAS and technology (y-axis), with a separate panel for each selected PFAS (Figure 4). The box represents the interquartile range of results (25th – 75th percentile), the vertical line inside is the median (50th percentile), the whiskers show the data spread (min, max), and the individual dots are the underlying data points from different studies or sites.
Selection Criteria: Filtering the Data
The left-hand panel contains filters (Selection Criteria) that allow users to narrow the data shown on the Box Plots to match their specific site conditions or technology of interest. Filters operate simultaneously; applying multiple filters further narrows the visible data points.
Available Filters
- Where Treatment Occurs (In-Situ or Ex-Situ)
- Target Media Type (Liquid or Solid)
- Treatment Technologies — Individual technology (select up to 3)
- PFAS Selection (select up to 5)
- Media Treated — The specific matrix tested (see list above)
Additional Notes:
- On the chart, you can hover over points to see details, use the magnifying glass to zoom into a region, the reset icon to zoom back out, the expand icon for full screen, and the download icon to export the chart image.
- The chart only displays a box plot when there are at least 4 data points for a given technology-PFAS combination, so sparse combinations may not appear.
- Box plots reflect the criteria you select and may include a mix of media treated, treatment conditions, and treatment scales.
- You can select up to 3 technologies and 5 PFAS compounds, so the chart shows at most 5 panels with up to 3 boxes each.
- Negative percent-reduction values are plotted at 0, and the x-axis is fixed to a 0 to 100% range.
Use the Technology Snapshots series for a deeper dive into how each treatment technology works, its known strengths and weaknesses, and links to ongoing ESTCP demonstration projects. Technology Snapshots are available for all technologies included in PFAS-ARC.
A box-and-whisker plot showing the distribution of percent reduction across studies for each technology, faceted by PFAS compound.
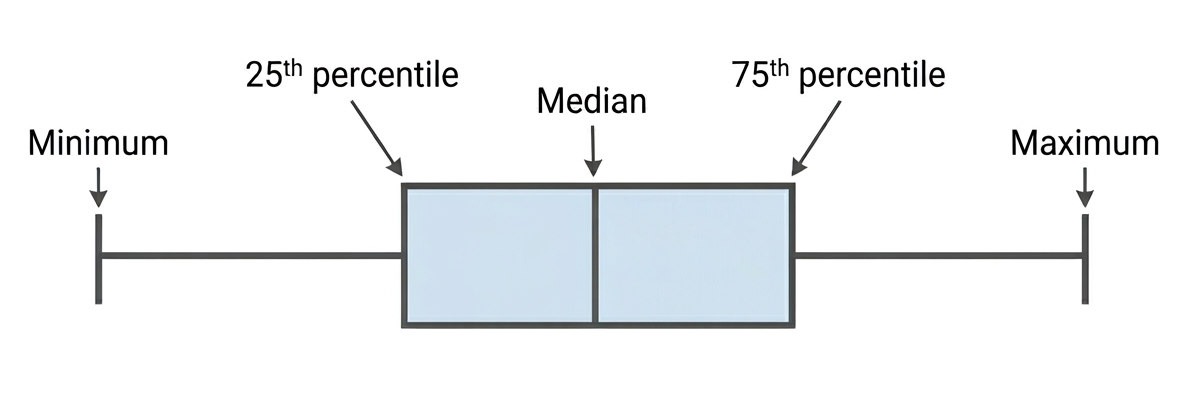
- Each point represents an individual study observation
- Box shows the interquartile range (25th–75th percentile)
- Center line shows the median
- Whiskers extend to the minimum and maximum values.
Minimum data: Box plots require at least 4 data points per technology–PFAS combination. Groups with fewer observations are excluded.